Now that we have a large number of charger users, lets explore in more detail what happens during a charge, and how plotting the charge data can tell us about the condition of the pack.
I wrote a datalogger with National Instrument Labview, that is designed to datalog the charger output in real time, as well as writing a file that can be reviewed later, or analyzed in Excel.
The program requires that you have a working serial port, either direct DB-9 rs232, or via an adpter that converts the rs232 from the charger to USB. I will elaborate here as we gain experience, but for now, you need to install two programs on your PC. I can only confirm that this works on XP machines, and know that a lot of cleanup needs to be done to make the program as easy to use as possible. The first problem was to get something that would run as a stand alone program, without requiring a full Labview development environment. SO down load the configuration program, unzip, and then run the setup program to install it , and the Labview runtime module on your machine. Then download unzip the datalogger. During the install, you will be asked where to install the programs. The location is not important, but it is important that both the config and the datalogger are in the same folder, as the config file that the config program generates, is required by the datalogger. Once both are installed, you will run the config file first. It will open running. The program first looks at the installed com ports and shows their system name. After the program loads the active ports, plug in the usb serial cable into an open USB port, and after the new hardware is recognized by the computer, you will see a new port apear in the config program. Scroll up on the select port until the GC COM Port window shows this new port. When that is finished, clich the set port >1 and that will lock the port selection. Next click the >2 to select the directory that your datalog files will be stored in. Finally click >4+5 to write the config file to the directory . After the write, >3 will switch to read, and you can again click >4+5 to read back the serial port,Config file path,and the Datalog directory. After this one time config, the datalogger will expect to see the port plugged into the same USB slot, and it will put the datalog files in the selected directory.You can close the config program, and then run the Datalog program. The window size and positions are still not clean, but the programs seem to be working, and as long as your monitor is big enough for the whole program you should not have any issues. The two zip files are here: Config V2.6
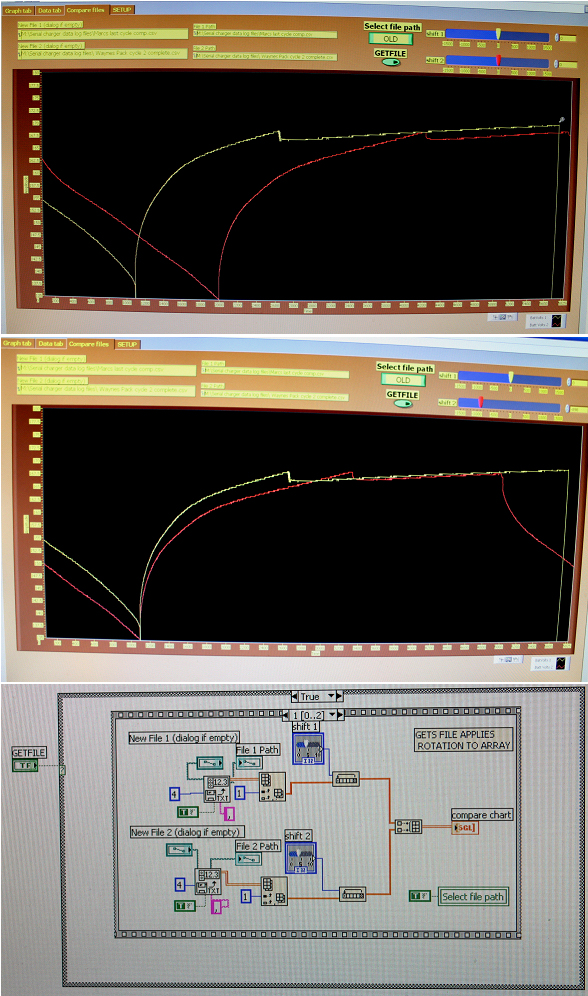
Just got the final part of my data logger/analyzer program to work. I wanted to allow two files to be compared by overlaying the datalog files over each other on a chart. Each file is located on the hard drive, and the files are loaded to the chart. The two slide controlls allow the files to be shifted in a circular way, so the data at the end of the file is added to the beginning during the read into the chart. The files are read over and over while the sliders let us shift them into alignment. once they are lined up, one can zoom in and examine the graphs. The two zip files are here: ConfigV2_6
Did a workaround for my Labview problems, so I could continue to do some testing. The graphs above are the same one as below, but this time I traced it with and without the drop out detect working. We see the same 5 cells drop out. The drop out detect is looking for the rate of change signature of a drop out in the data. Some close ups show that the dual running average difference is a good indicator of the rate of change, and works well for detecting too rapid drop off, topping detection on the charge side should work more reliably that the sample timer system.
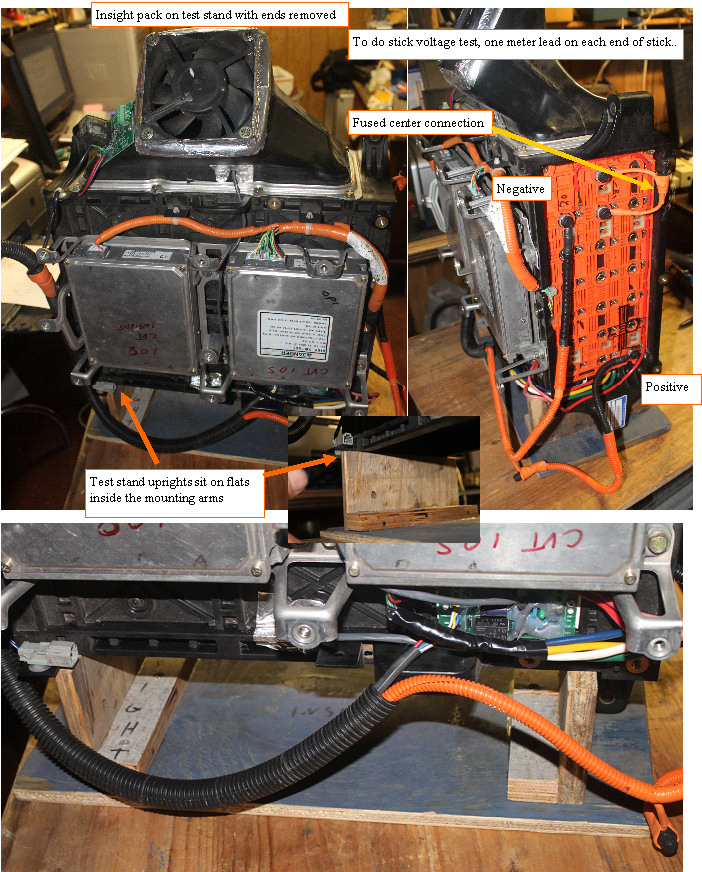
How to test a battery to the stick level on the bench
Or my gridcharger and discharger. The grid charger with discharger can cycle and isolate the weakest sticks in a whole pack quickly, and since that's what you want to do, anyways, there is no need to take it apart and cycle each stick separately. Using the datalogger to get a better look I will be doing a video on how to do that process once I get the grid charger backorders built up and get some time.
For now, I will talk about the different aspects of the process, and some considerations.
Charge termination: The cells can take a high charge rate until they get full, and then they very quickly turn all the charge into heat, so the best overcharge test you have is to simply touch the cells when the charge is nearly complete. 350ma will get a cell lukewarm, as the heat is easily dissipated by the large surface area of the cell case. the cells in the middle of a stick will get hotter than the end ones as the ends are sharing heat from the adjacent cells.
1A in the full cell will get the cell so hot that it will be uncomfortable to hold it in your hand.
2A will cause the cell to get so hot that in 5- 10 minutes after it reaches the full point it will likely vent fluids and permanently loose capacity, as well as giving a good skin burn if you touch it.
10A will heat to the vent point in less than a minute.
Since the hobby chargers can charge at up to 10A, it is very important that you confirm that the cells are not getting hot when the charger/cycler stops charging. If the charger lets you charge at high current and then drop to trickle of 200 - 500ma, that is better than letting the full current run to the end, as not all cells will get there at the same time, and the balancing will not be as complete.
The deltaV charge determination will work best once the cells are balanced, as an unbalanced pack may see one cell reach deltaV just as another is still rising,, so the charger will not see the first cell deltav and could overcharge the first cell. All of the different hobby chargers have similar features, but all will not do as good a job of accurately terminating the charge . This is why the 350ma range is so nise, as it can be maintained for as long as required to get that last stubborn cell to full, so we can say that the pack has all fully charged cells. The cells may not have the same capacity, so when we discharge after a topping/soaking, we are truly seeing the weakest cell/stick in the pack, as they are all discharging at the exact same rate, so first guy to die, or drop out is the lowest capacity stick.
If 3 cycles does not improve it, it is probably not worth trying to save, so mark a red X on the stick, and continue to discharge to find the next weak stick. We need a lot of refinement of the technique to figure out the best formula for the test, but a technique like this may yield better results than the individual stick cycling, in much less time. All of this can be accomplished on the bench without the need to fully disassemble the pack.
Discharge determination: When discharging a multi cell pack, one must always be aware that one of the cells could be much lower in capacity than the rest, and that cell will drop out first as it uses up the 3-4AH while the higher capacity cells in the stick may still have another AH of capacity.
The voltage method of discharge detection for the hobby chargers is simply looking for the overall voltage of the stick to drop to either .9V/cell or 5.4V for 6 cells. 1V/cell or 6V for the stick. A fully charged stick can be >8V
A cell drop out when the pack was @ say7.8V would drop us to 6.6V, and would not stop the discharge, as the total stick V would still be well over the <6V required to stop the discharge with min V set to 1v/cell. An early cell drop out may not even be detected, so one would be wise to confirm that all the cells are still in the range of the rest of the cells in the stick right before the discharge terminates. The lower the voltage cells can discharge to as a group the better the stick balance is.
The gridcharger/discharger will charge the whole pack, and then discharge until the first cell drops out, and at that point, with the pack on the bench ends open, you can simply measure the sticks while the discharge is continuing, to see which stick was the weakest in the pack. You can also pulse the discharger and get an approximate test of the internal Resistance of each stick, by measuring only the AC voltage across each stick.
Self discharge test: A charge /discharge cycling of the pack, and recording of the run time of the last discharge gives a whole pack after conditioning value DCT that is the whole packs capacity. Since we want to identify the weak sticks relative to the rest of the sticks, this test all the sticks at the same time with the same load, under the same delay since the conditioning was done, and on the bench, can identify the weakest sticks in the process, it is a huge improvement over testing single sticks if the goal is to find and replace the weak sticks that are causing the problems.
On a stick level test with a hobby charger, one must cycle each stick, record the last discharge as an AH capacity, recharge, and then let the stick sit for a week or more and then discharge to see how much capacity was lost between the last discharge after the conditioning, and the discharge after sitting. The accuracy in charging to the full condition, and accuracy in waiting the same amount of time to do the delayed capacity test can all introduce errors, which could mask a weak stick.
Discharge current./ internal resistance The sticks are asked to put out peak currents near 100A. At the higher currents, the cells internal resistance becomes an important issue that will cause the car to set IMA codes. A 170V pack that drops to 110 - 120V when you ask for 100A, is suffering from high internal resistance. The cells with the high IR will also heat up, as the current is driven through this higher resistance and can trigger temperature related codes. A good pack may only drop from 170 to 150 under the same load The hobby chargers usually will not do a good job at measuring this aspect of the battery. The 10A load will cause a voltage drop, but it is also discharging the cells, which also causes the voltage to drop. A high discharge rate also means that one must be even more careful of the final discharge detection, as the 1v/cell drop could prematurely be reached if the cells have a high internal resistance.
A pulsed technique, where the discharge is pulsed like the charger/discharger can generate a small AC voltage across the sticks DC voltage that only shows the difference between the unloaded and loaded pack, and since we can also see each stick, a bad stick should show up clearly.
I am working on a bench accessory that will allow a >50A load to be precisely applied and removed from the single sticks to get a more representative measurement of this important value.
Several failure and deterioration modes can be present in a pack at the same time.
A.Shorted cell (zero volts) Zap with capacitor is only way to try and correct that, but I have not tried to zero in on the best volts/capacity combination to use.
B.Vented cell(overheated) Permanent loss of capacity, no amount of cycling can bring it back. A vented cell will have expelled a tiny amount of potasium hydroxide, due to high internal temperatures and pressures.(overcharging, overheating) The dried slippery feeling hydroxide will burn your skin, so if you see any whitish stain on the inside of the heat shrink, the stick probably has vented.
C. cell with memory effect or voltage depression Caused by unbalanced pack, vented cells, aging, where the higher capacity cells never get to fully charge due to the cells that have lower capacity charging faster and stopping the charging process short of full capacity. Cycling will help get the capacities balanced
D. Cell with high self discharge Nickle whiskers grow between the plates, and lead to higher and higher self discharge, further magnifying the unbalanced condition. Cycling helps to dissolve the whiskers and self discharge improves.
E. High Internal resistance Loss of capacity, and venting , reduce the cells ability to hold its output voltage under heavy loads, so a stick that may test at 6AH at 2A load will heat up, drop its voltage, and nearly drop out immediately at 60 -100A .
Note that I am talking cell, not stick, a stick could have more than one type of failed/reduced performance cells, so stick testing by its nature will only yield good results if the cells within a stick are of similar performance/ and degradation.
So a "bad stick" is a stick with one or more bad cells, and I expect that any used stick we can find will likely have degradation of one or more cells, so there may not be any "good" used sticks left. Bumble Bee batteries told me that he would be selling single sticks of the new Maxima cells (better battery). I tested a stick, and the cells looked solid. With the charger, The best repair may be to identify the weakest stick in the pack, with the charger/discharger, then replace that with a new maxima stick, and use the charger to rebalance as required. Maybe one identifies the worse 6 sticks and replaces all of them. The charger keeps the known unbalanced pack (New mixed with old sticks) balanced. When that no longer works, identify the next bad sticks, until the whole pack is replaced. It is likely that only 2-3 sticks are causing all the IMA codes and loss of performance that many are suffering, although, I have seen whole packs that have very low capacity, more in the civics, where the cooling system is questionable, and vented cells are found.
So much more to say, and I hope to cover all of this in more detail on a video soon. Please consider all I say, as my opinion only, and I welcome people to offer alternative opinions so we can all better understand this pretty complex set of failure modes and how they interact to cause a pack to behave badly. We have 100 testers with chargers, and another 50 are about to be unleashed, then I will get going on the Video version of this blog. Good luck. Mike
Remote monitoring of the charge process
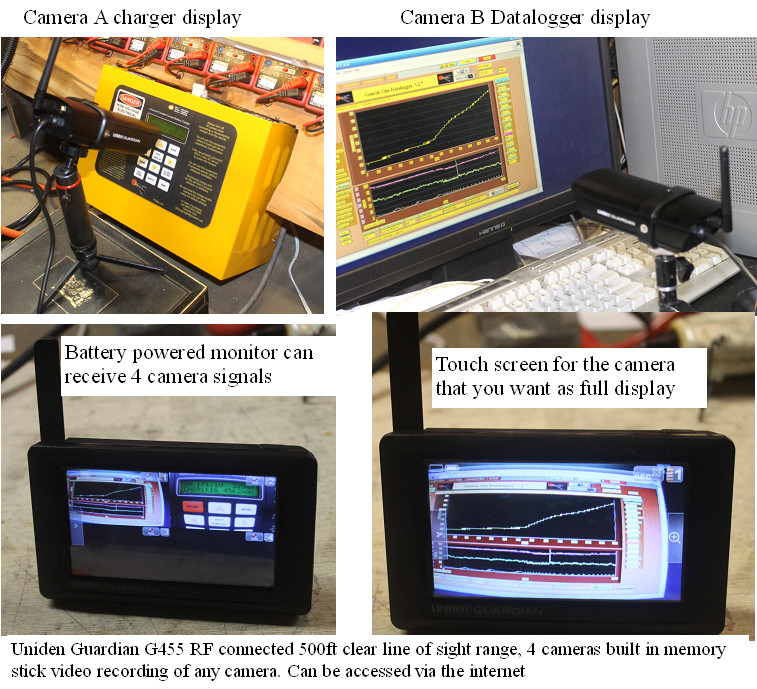
portable remote monitoring
Was at BJ's club the other nite, and saw a cool Uniden video surveillance system with tow camers and a monitor. The unit can use 4 monitors, had built in memory stick recording, and the cameras have a 500 foot transmision range. Been looking for a video system, so I got one. After playing with the unit, I found that it did a decent job and has good resolution.Walls, metal things will reduce the range, but I found that I could place the cameras anywhere in the house and be able to see the video from anywhere in the house. I was running a soak on a pack, and wanted to keep tabs on the progress, so I set up the two camers one looking at the labview graphs, and the other reading the charger display, Works nicely. The cameras can work easily between the car and the house, so remote viewing of the charger progress in the car is also possible. Cool gadget, but not I need to get another so I can use it as planned.
Datalogging Labview style
Test run with labview data logger
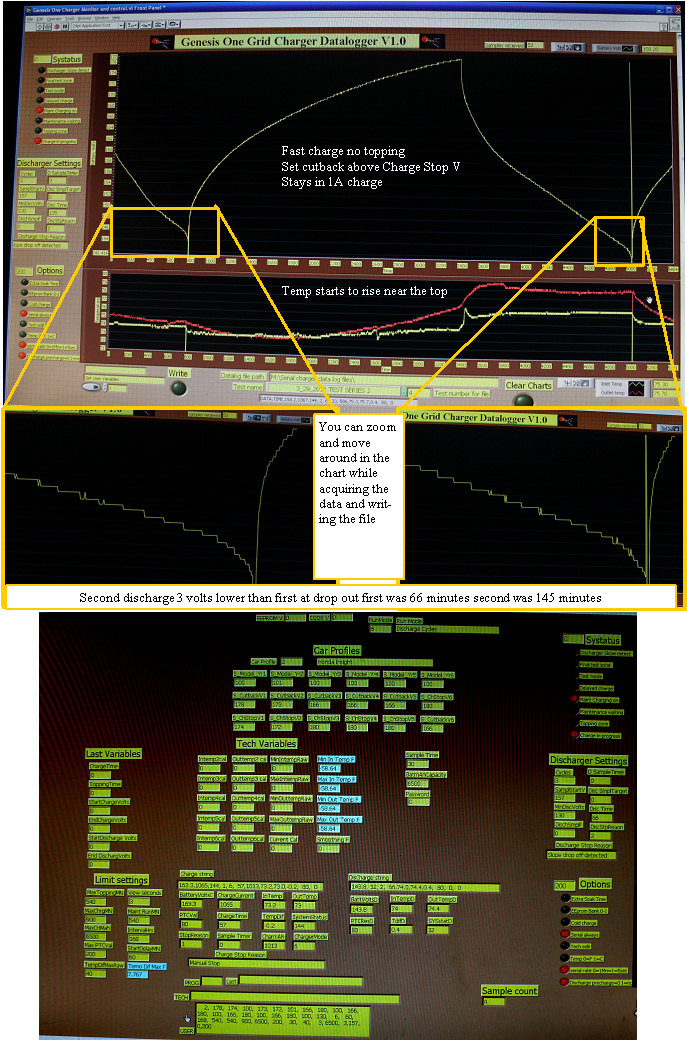
I have an Appointment to meet with a Labview expert on Sunday, and I hope to come home with a runtime version of my Labview datalogger that you can download and try. The screen shots above are where I am today, and I expect it will look quite different after my Sunday session. This graph shows the end phase of a discharge followed by a charge then the second discharge and begining of the following charge, The chart can be zoomed to a region of interest, you can scroll around, change the scales, all while logging the data to disc and displaying the current charge. Software also allows upload of all variables, and can permanently write new values to all eeprom locations as well as read them individually. The charger can be started and stopped from here as well.
The Big picture The car has taps at each 12 cell section of the pack, and we have been assuming all these years that it is specifically for watching for a drop out as well as looking at the tap to tap match. that is the drop out protection that is doing the recal activation, which we also assume is the recovery from a drop out. This means we expect the car to stop assist when a cell drops out, so if our assumptions are correct, which I have not seen any evidence to the contrary, using the car to cycle while not as deep a discharge as the discharger can achieve, it is totally safe if it in fact works as we assume it was designed.
The detection of a cell drop out in the middle of the full 120 cells is 10 times more difficult, and would never work in the car, as we are constantly charging and discharging, with the associated delay in returning back to the steady. With a discharger under the chargers control, we have a steady state ~2A discharge, and the voltage drop over time is a good indicator of a drop out mainly because it is so steady, and when the cell drops out, we see a quick drop of ~0.6V to 0.8V, then the slope returns to the earlier slope. On a fully balanced pack, we will still see the weakest cell drop out first, but it could wait until the whole pack is starting its dive.The lower the drop out voltage the better the pack.
If a load is applied, the voltage immediately drops due to the IR, then it drops due to depleting charge. The more current the larger the voltage shift. On the charge side we again immediately see a voltage rise, that is proportional to the current. A pack will increase in IR as the cells age. A voltmeter, or Peters OBDII gauge, will show the battery voltage under the various real time loads and charge conditions, and a good approximation of pack overall health, is possible by watching how low the voltage drops under full assist conditions. A resting (no assist or regen) 155V pack, may drop to less than 120V during heavy assist, and then pop right back to nearly the same 155V on returning to the resting state. A better pack will not drop as far with the same load. Same on the regen. If the pack hits 180V+ during full regen,and it drops very low during assist, it is suffering from IR issues, and may not recover as well with cycling as a pack that has lower IR.
I believe the OBDII gauge has an IR measurement based on this voltage drop, but the measurement suffers from the delayed recovery of the voltage after a shot of assist or regen. The voltage stays elevated for a period of time after a burst of charge, and stays depressed after a burst of assist, so the voltage is bouncing all over the place, which makes this a difficult measurement to make with high accuracy, but a relative IR reading is still very useful in answering the big " how do I know the condition of my pack" question
A very slow discharge may not show a drop out as easily as a higher current faster one, as the difference between the rest of the pack discharge slope could be quite similar to the cell drop out slope and be difficult to pick up. I begin the testing of our new drop out detect software this morning. We now have several detection processes operating in parallel. 1. If the pack is dropping too quickly during the initial slope detect which starts at a voltage we set for the pack voltage, it indicates a very weak pack. 2. We compute an average slope based on the time it takes for the pack volts to drop 5 bits. this sets the detection target rate of drop, which works quite well on any fast drop, but a slower slope may in theory slip through. 3. We have a minimum discharge volts setpoint, that will stop a discharge if the target voltage is detected, so on a questionable pack, you can set this high, and ass the cycling progresses, and the pack gets better, it can be lowered. 4. The new dynamic slope detect system works in parallel, and it derives a running average of the last 50 data points, and a short term average of the last 4 datapoints. this presents a look at the last 4 datapoints as they relate to the long term running average, when in the normal operation zone, the two averages will show the same value, but on the more rapid drop out, the short term average will reflect the faster discharge slope. The sample timing is increased to give more samples so the slope angle can be more accurately determined. So with your eyes as a drop out test, dont blink. With the charger in control, we have 4 ways to assure we see and stop the discharge, so the cycling procedure is much safer. The idea is to let the thing run 3 cycles unattended by humans, and we go back and see the results when it is finished. Of course as with the charge, we show the reason for stopping the discharge, so one can better understand what is happening.
getting a better overview
Draft version of data logger
After playing with the data logger from parallax, I decided we should have a more user friendly system that would not only save the data for analysis, but show the data in real time while the charger was running. This screen grab of the program is not the final version, as it does not have the file saving set up yet, but shows how the basic system would look. The graphs are dynamic, so things like scrolling through a long data stream, changing scales, and many other cool things are built in. We have added the capability of the PC based program to change any variable, read the actual variables, start and stop a charge, and control the charge from the PC. This allows the much more capable PC based program to do diagnostic as well as data logging and graphing the charge, as well as comparing previous charges to see how the charge profile changes with successive charges.
Getting past the drop out to see what is happening.
Seeing what comes after a dropout and testing the slope detect
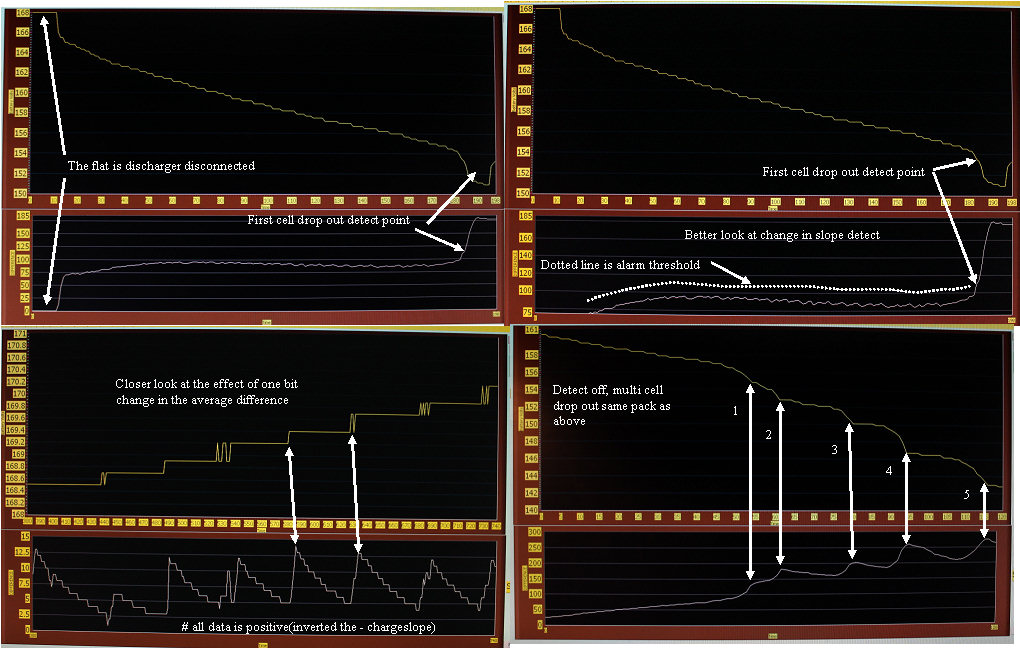
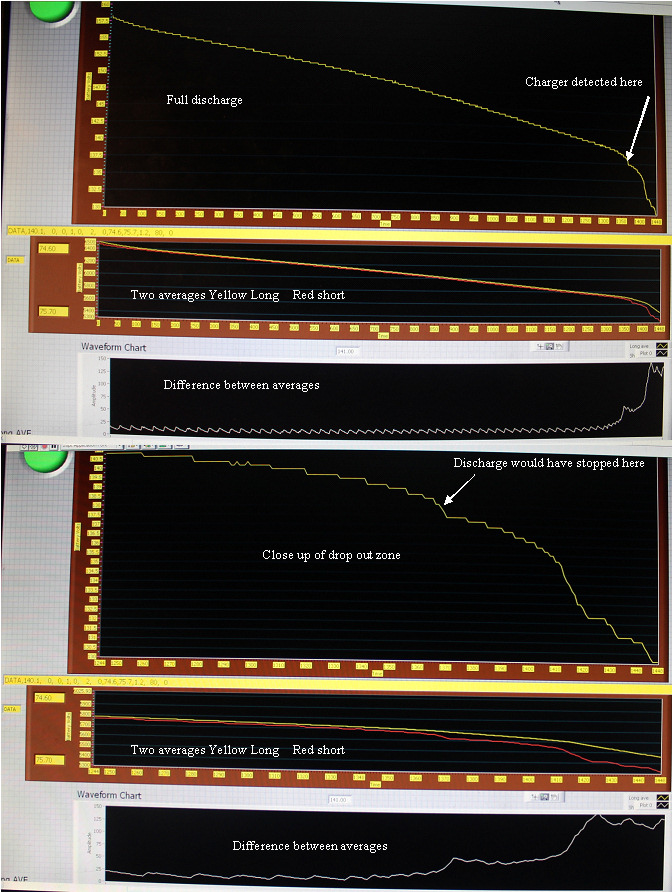
Charged the pack very well overnight, and did another discharge,with the automatic detection only giving warnings instead of stopping,so I can discharge as deeply as I need to during this important test.This time I display the long term average of the last 50 datapoints,(Yellow) and the short term average (red) on the second graph.
On the third graph, I show the difference between the two averages. The ripple is the effect on the short term average as a bit change happens. We see that the actual slope of discharge relates exactly to this difference. When first starting the discharge after a charge, we see a big number(missed it on this graph),but it was near 100 this number drops as the slope flattens out, and gets into the stable zone. On this Civic pack, on the top photo, you can see how consistent the rate of change was through most of the discharge. The differential between the two averages was at 6-8 through much of this linear slope. The cell drop out, and the 4 others that followed were at a bit lower voltage than the drop out yesterday, so the cell is still improving. The blip in the slope detector trace shows the rise in drop out slope when the first cell (subpack 10?dropped out,and that raised the difference from the 6-8 to about 25, and a more substantial increase when the rest started to drop, which reached over 140 before I stopped it manually.Clearly a nice clean signal. The first slope change triggered the time/bit change detection system,and would have gone back to charge. Once past the detection point, the charger was beeping at me. I need to know if it was a real drop out, so I had to let it go. I figured I needed to see if any others were ready to go, and sure enough and saw 4 more cells take a dive before I stopped. I used this opportunity to remove the ends of the pack, and try to identify the weakest subpacks. I turned on the discharger and recorded the following voltages. 1) 5.60 * 2) 5.72 * 3) 7.03 4) 6.92 5) 5.59 * 6) 5.77 * 7) 7.04 8) 7.09 9) 6.99 10) 4.01 * 11) 6.95 12) 6.94 13) 7.07 14) 6.96 15) 6.98 16) 7.06 17) 7.05 18) 6.99 19) 7.05 20) 7.04
Looks like sticks 1,2,5,6, lost a cell, and stick 10 lost 2. At this point I could pull those sticks, and determine the bad cells, replace them, and the pack would be in much better shape. May present a way to fix a pack fairley cheaply? I will get my cell level tester going again, and see what the cells in the weaker sticks look like.
Drop out test needs more work
Second cycle old insight pack
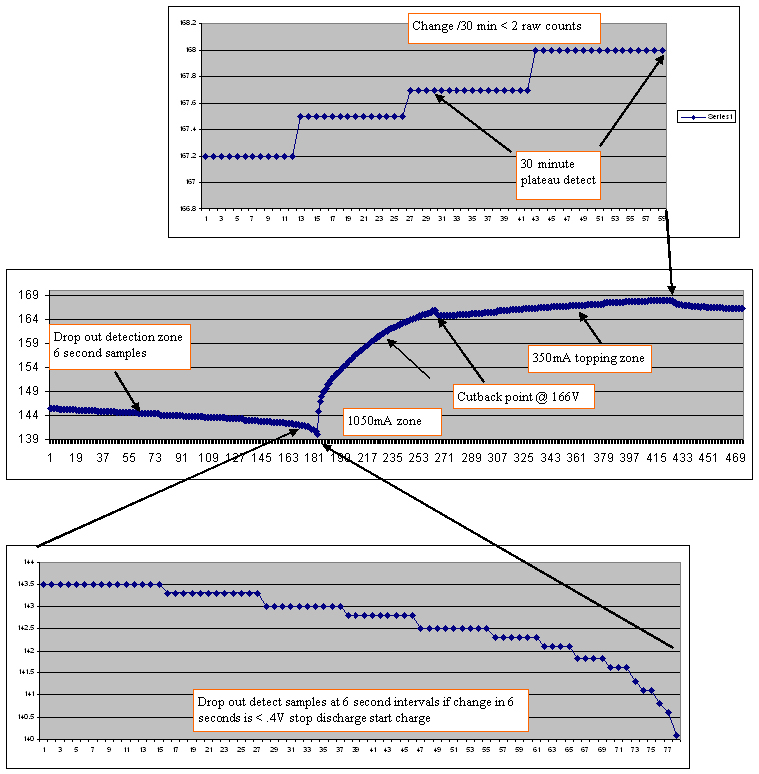
The second charge of the Insight pack showed increased capacity, and the cells held up longer on the bottom end, but it also showed that our simple drop out detection system was not good enough, so we must change the way we detect the drop out. The present thinking is that we will look at the rate of change during the linear part of the discharge, and then look for that rate of change to shorten to a percentage of that rate, as a drop out detect, this will allow us to detect the cell(s) as they begin the drop, rather than looking for a specific number on voltage drop / unit of time. The 30 minute topping detect could also have been longer as the pack still seems to be rising when the charge was terminated
The signature of a cell drop out
whole drop out event
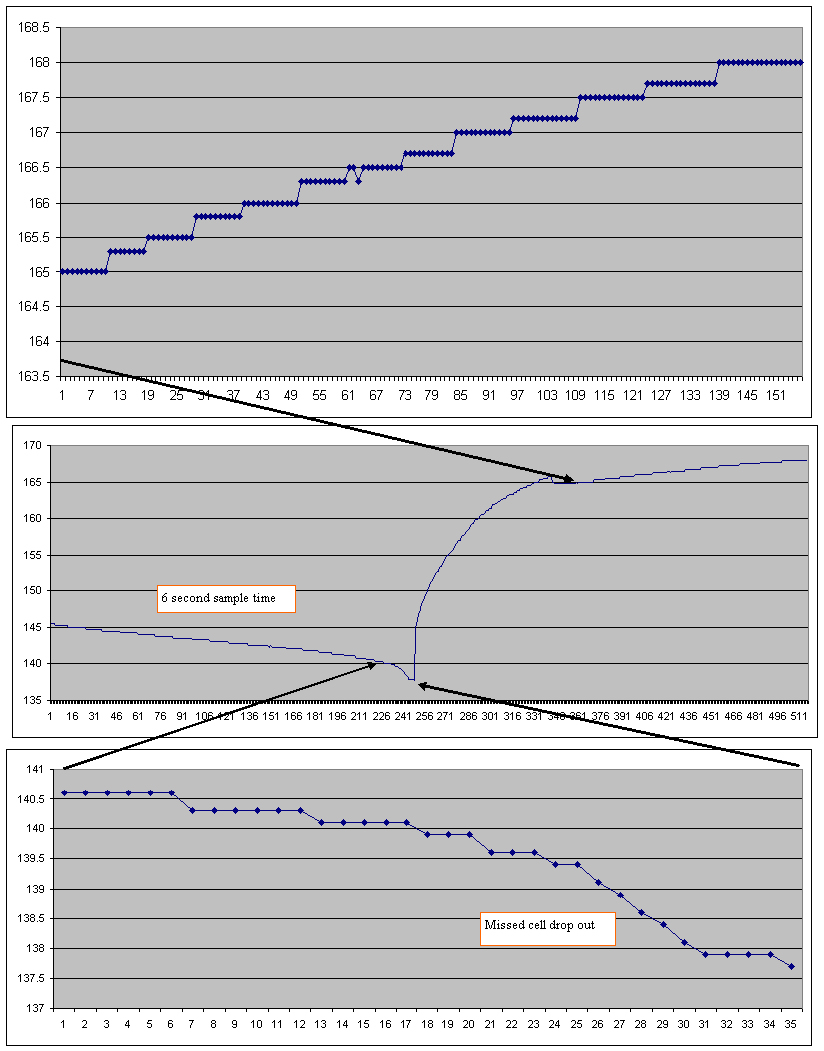
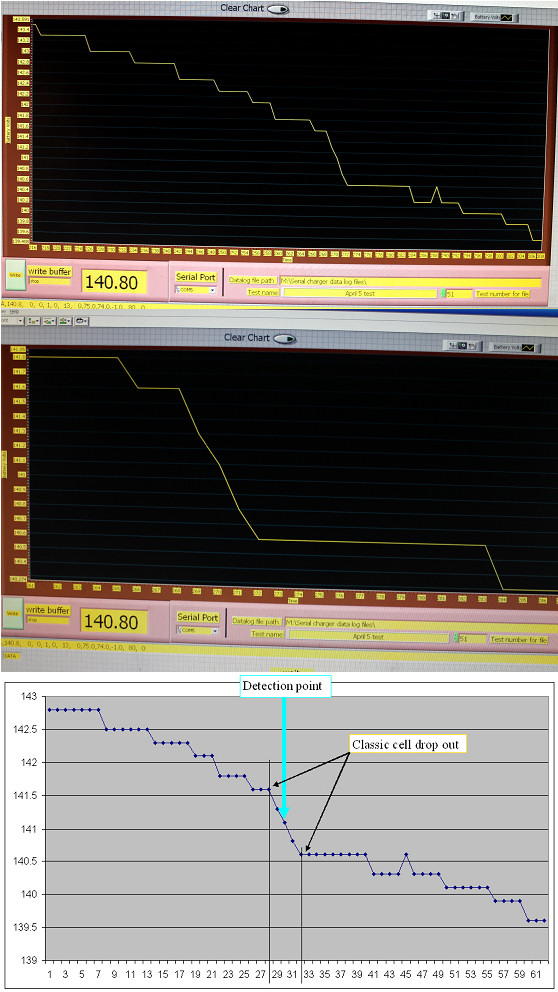
For testing the pack discharger, we need to get some data on what a typical cell dropout looks like, so we can tune the dropout detection system. This test version of the charger software allows us to hear a beep when the detection system wants to stop the discharge and start the recharge, but allows us to let it proceed past that point to be sure the detection caught a real drop out. Here we see the cell drop out in three views, 1 as a part of the larger graph, 2, zoomed in with only the cell drop out filling the screen, and 3, using excel to graph the recorded data. We see just about 1 V of drop at a much faster rate than the trend. One bit / 5 second samp-le, or about 20-30 seconds for the full drop. The discharge slope after the drop out went back to the same slope as before the drop out. The detection system picked upthe drop out a bit after the second sample. Worked nicely. You can see from this graph, that this 20-30 second event could have easily been missed just by looking at the display, as there is no trend line. The Labview screen shot is part of the revised program taking into account some of the lessons learned last Sundays Labview class
Insight pack end of discharge full charge #1
Discharge and charge old insight pack
This old pack was soak charged until the voltage stuck at 168V. Then it was discharged so we could observe the cell dropout detection, and then it was recharged with full 30 minute plateau detect. The areas of interest are plotted on separate graphs to show the details
Waynetc pack
Balanced but weak pack looks good at 2 A discharger rate
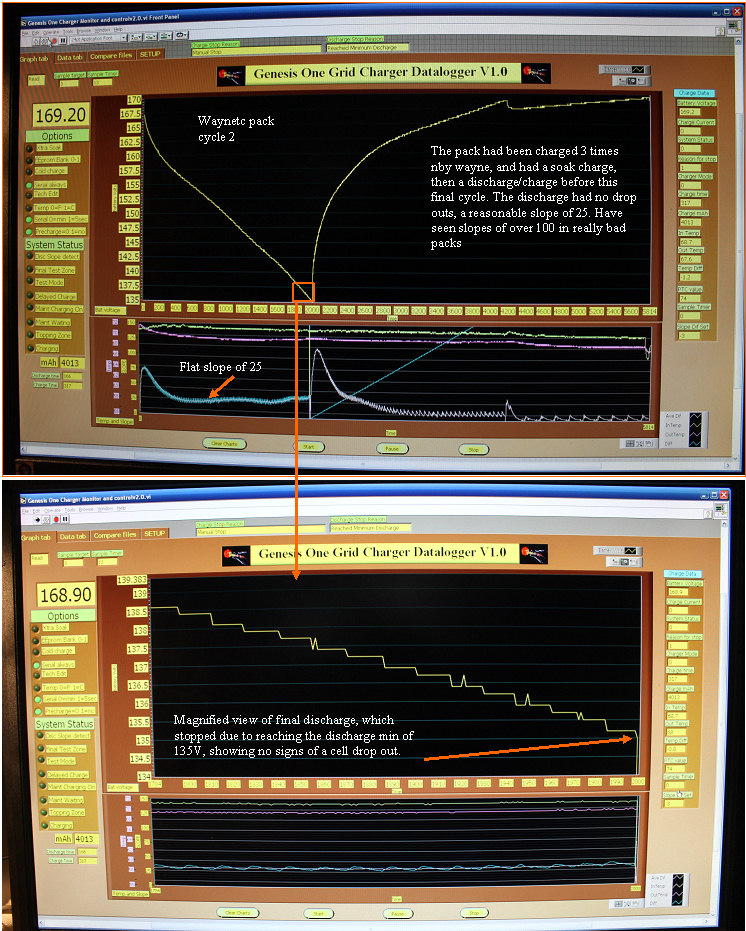
Waynetc from Insight Central sent his pack to me via Ray Holan who was coming out for a charger harness and MIMA install. Wayne had discharged the pack so we started with an 18 hour soak charge, and then discharged. I did not have the datalogger available as Ray was setting up a Database program for me to give me better order tracking and inventory control. (Thanks Ray) The pack discharged down to the Minimum discharge voltage I had set up at 135V. Got 130 minutes of discharge.As we can see from the close up, and the slope graph not showing the charistic increase in discharge slope that we have seen before, so this pack probably could have been discharged to a lower voltage, the slope ending on the flat shows it still has more to go before depleted. I recharged and set up the datalogger to capture the second cycle, which ran for 166 minutes of discharge. We can see from the nice reasonably flat discharge slope graph that the discharge proceeded at a reasonably nice rate of 25. Lower the number the better the pack can provide current under the ~2A load. Have seen 4-5 minimum slope on really good pack, and as high as 120 slope on the really bad silver pack with multiple cell drop offs. Since 2 A is a low discharge compared to the cars 100A, we will need to do more testing to see how the 2A data reflects the higher currents in the car, when I get the 60A stick discharger ready. Wayne reports that his car would only provide 2-3 seconds of assist and then it drops to 33 - 50% assist - this is with or without mima. He can do this over and over again, or hold the joystick forward and get very mild boost. Then after a while the assist gauge will go from 19 - 20 bars to about 3 and it starts to charge up again. That's when it pops codes - usually 1447 - 1149. High IR? We will see what happens. He will let the pack sit for a week while he does other work, and will do another discharge then, so he can get an idea of what the self discharge is like. Will log the self discharge over the week.
We are looking at making an automatic stick by stick 60A discharge tester that would tie into the discharger jack.
A new mode 8 will be made (Code V2.3). The idea would be to open the pack. clip big alligator clips to the ends of each stick,one at a time. A press of the start button,would do a test which would read the whole pack voltage, turn on the 60A load, wait a programmable delay, take another reading, then turn off the load. The difference between the two voltages will represent the high current discharge internal resistance of just that stick. Run through the pack,write down the results and we will have an accurate stick by stick internal resistance value. Lets see how Waynes pack works regarding self discharge as well as how it responds to the real world load of normal driving after he gets it back in the car, and may want to use his pack for the high current stick level test to help us better understand how to qualify the packs and the subpacks within it.