What actually goes wrong with the batteries???? | 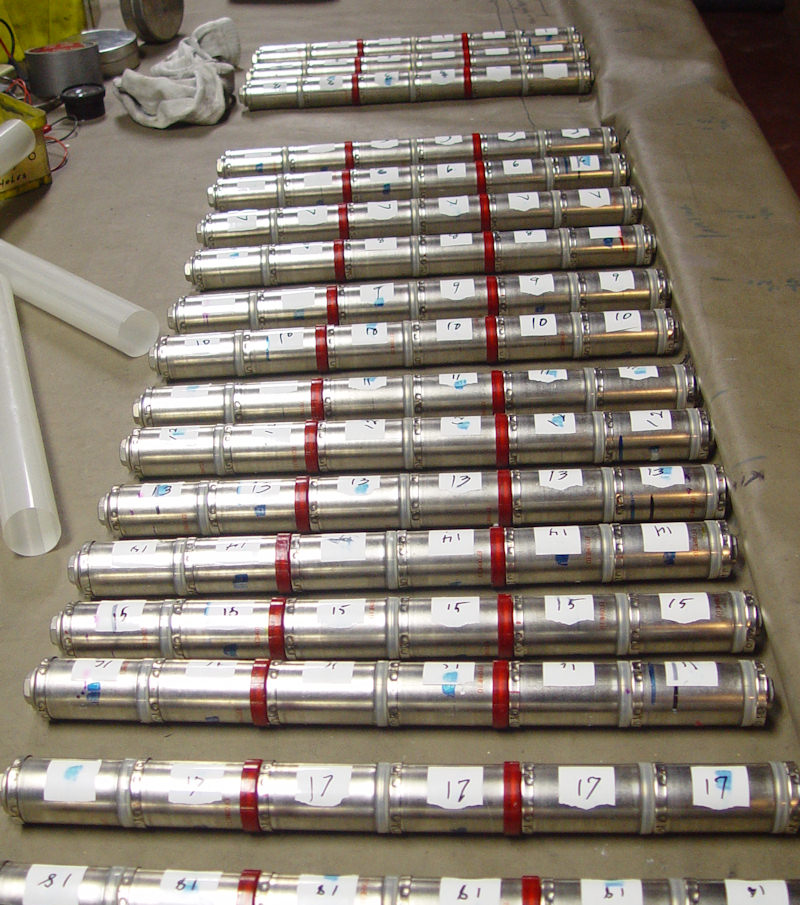 | | | What is wrong with these things |
Hybrid battery packs develop several problems as they age, which are aggravated based on temperature history, and length of time spent inactive.
Inactivity allows the cells to self discharge, and since all cells are going to do this to one degree or another, and the rate of self discharge can be quite different from one cell to another, a typical pack that is setting codes like the 1449,1447,1433, will have cells that have fallen way behind others , and the IMA control system which works to keep the cells in the 20% to 80%, has no mechanism to rebalance them.
All Nickle based batteries develop this self discharge because they can spend a lot of time sitting at a middle SOC, where Nickle dendrites (little whiskers of nickle) will grow and gradually provide a leakage path between the + and - plates, eventually leading to a shorted cell.
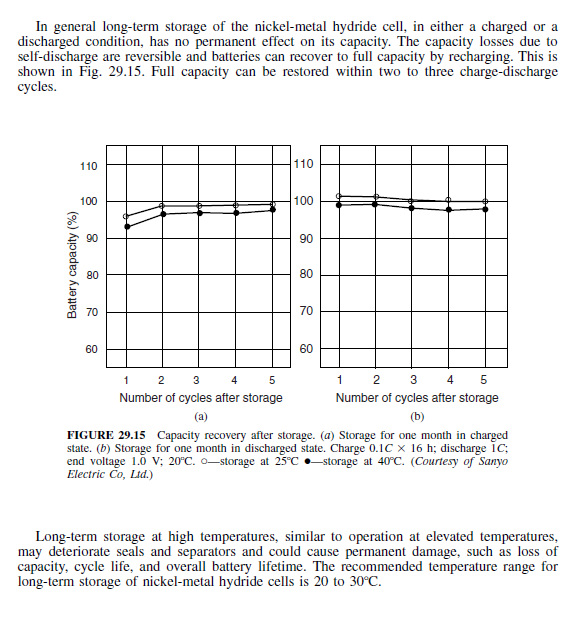
Storage and self discharge
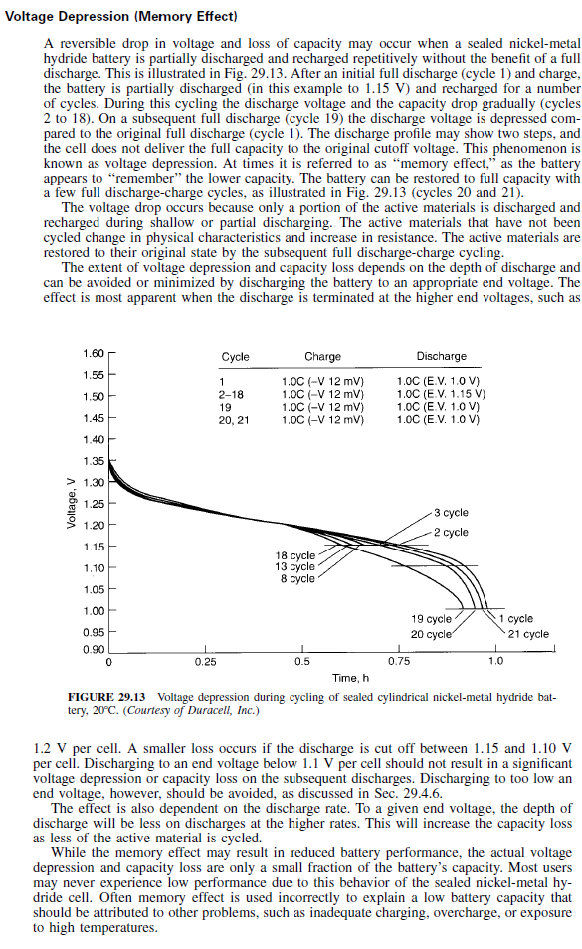
Another thing that happens when a cell drops down in the SOC relative to the other cells is it develops an effectively reduced capacity that is recoverable called Memory effect.
memory effect
Memory effect capacity loss is reversible by fully cycling the cell from 100% to less than 1V/cell.
So the code setting pack has this unmatched set of cells with widely different SOC, and wide spectrum of effective AH capacities, which reduces the effective capacity of the pack as a unit to a value that sets the code.
When the car charges the pack to full, (80% SOC) it stops when it thinks the pack is full, with the assumption that all the cells are the same, where in fact some cells are still only partial charged.
The discharge limits are also skewed so the pack stops allowing assist long before the highest capacity cells are empty because one of the low capacity cells has dropped out.
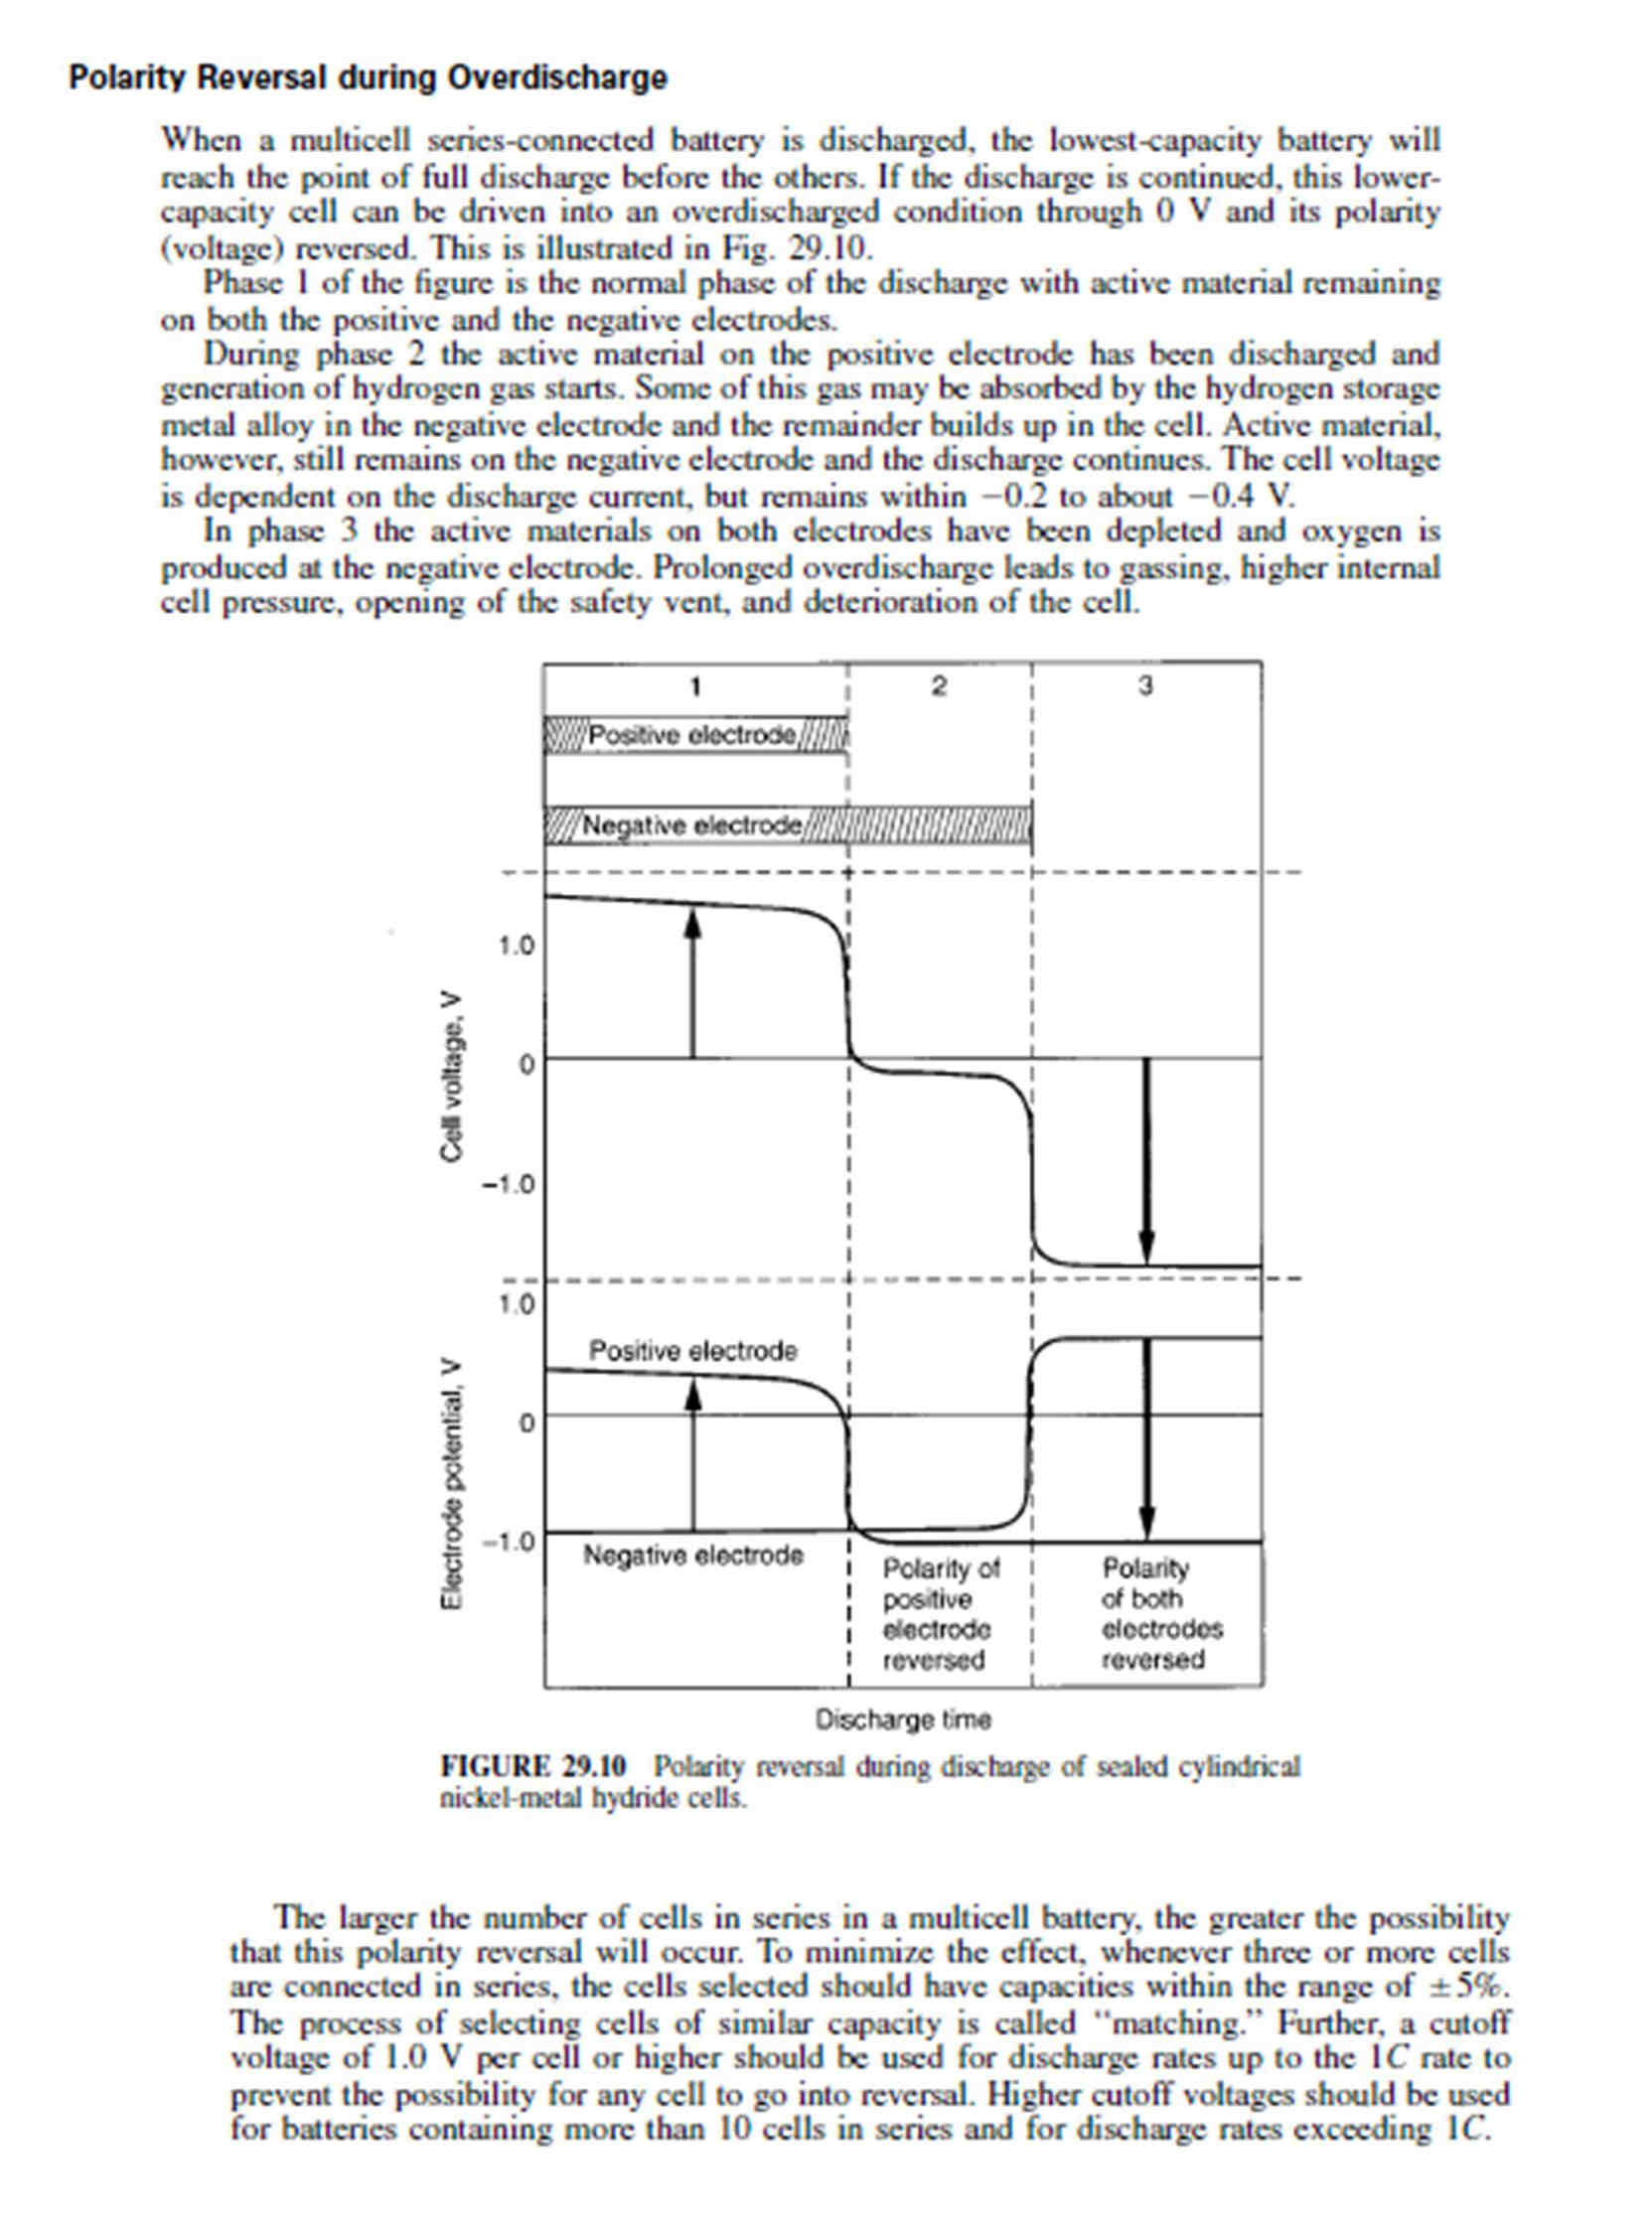
When that happens the rest of the pack discharges through the empty cell effectively reverse charging the cell.
Cell reversal
The IMA safeties kick in causing the SOC guage to drop to the bottom, and aggressive charging begins to pull the reversed cell back from sure destruction.
The longer the pack is used like this, the worse the pack gets.
Another factor in this picture is heat.
Once a cell gets to 140F the internal pressure can get so high that it vents potassium hydroxide and the cell will permanently loose AH capacity. No amount of charging can bring back capacity lost due to venting.
The charger and discharger system will first fully charge all cells to 100% SOC, for the first time since the pack was installed. This can take a long time, as we have to limit the charge current so the cells that fill up first do not overheat.
When a cell is fully charged, all the charge energy becomes heat, which is why the cooling fan should always be used during charging.
Getting the whole pack to 100% will fix some packs, especially ones that have become unbalanced due to just sitting and self discharging, and have not developed any memory effect.
Hypermileing where you do not use the pack much can cause the pack to develop the same self discharge unbalance.
Most packs have both memory effects and real capacity loss, as well as differing degrees of self discharge, so the discharger aspect of the system becomes a great tool to extend capacity on the memory effected cells by cycling the pack between full and the detection of the dropout of the weakest cells in the pack, The idea being that the weakest capacity cells are the ones causing the problems, so since they will be the cells that get the deepest discharge, if the issue is memory effect those cells will recover capacity with each cycle, and the minimum voltage reached during the discharge should get lower and closer to the 1V/c level which would be 120V on a 120 cell Insight or first gen civic. A well balanced pack even if at low capacity will discharge uniformly so the discharge would stop at near 1V/cell.
In the real world that is seldom is seen, since all packs will have several of these issues happening at the same time, so there will be a point where the discharge will repeatedly stop at the same elevated voltage, like 138V. At this point the cell that is dropping out is likely one that has lost capacity due to venting or simply age, and to get that pack back in balance, we look at the other cells when that cel drops out to see if they are also ready to drop, or if the majority of them are still quite good.
At this point, if the car is still setting codes, we need to take the process from the car to the bench.
Using a procedure that we are still tweaking, we can use the charger/discharger, and datalogger to discharge the pack with the ends open so we have access to the ends of each stick, to make voltage measurements.
If the other cells are still well over 7V replacing the stick that dropped out with one of higher capacity, would then allow the cycles to continue to reduce memory effect and increase capacity of the rest of the pack.
The photos and graphs below were done with my cell level test fixture and Labview graphing program for my pc.
This is a graphical analysis of my Insights Subpacks after I got an IMA and Check engine light. The pack never did recalibrations, and it set the IMA code several days before setting the check engine code.
P1447 set the IMA, P1449 set the check engine. A system reset would not clear the codes. Each subpack was charged most of the way, topped off, then discharged while watching the temperature and voltage across each cell.
I looks to me like subpack 10 and 12 are the guys that set the code. I hope to be able to replace the cells that are bad, cycle and rebalance the rest and try the pack back in the car.
Please feel free to comment on the graphs with your opinions about what they show, my comments are very preliminary since I have only put them through a single cycle so far.
I charge @ 5-6A, and can do a high rate charge of 30A. The discharge is at 30A, and can be increased to ~70A.
|
Using the charger to run a deep dischargeI have now had enough experience with the deep discharging, and have seen enough data showing the improvements it can bring, that I will explain the procedure, so that people that have found marginal recovery of their pack, can explore this process.
Of course this process will allow some cells to fully discharge, and even reverse charge, which seems to be ok for low currents and short periods of time.
See:
Cell reversal
The procedure used is a bit cumbersome, as it was not anticipated when we wrote the code that deep discharging would be as useful as it is starting to be.The recently released V 3.01 of the code will have the deep discharger automated and will be a one press automatic procedure.
Of course the charger needs to be running at least V 2.4 code and have the discharger accessory.
The following procedure, for simplicity sake requires that you precharge the pack with a regular mode 1 or mode 2 charge before starting.
Step 1
Connect the discharger and the charger to the battery pack, either in the car or on the bench.
Step 2
set the charger run mode to mode 6(run mode key, then edit/display to change the mode, and edit/display to save the new runmode)
Step 3
Now we need to setup the following charger variables, by scrolling to them and using edit/display to change them to the indicated values.
SampleTime* = 60 (will do a thorough recharge to plateau)
C-DcyclesMax* = 1 (will do single discharge cycles)
This variable will be adjusted after each of the discharge recharge cycles completes.
These values are simple suggestions based on a 144V nominal pack and you may want to start at a higher value if the pack you are conditioning is a 158V HCHII or 200V Prius pack
MinDischrgV * cycle 1 set to 100V
cycle 2 set to 75V
cycle 3 set to 50V
Step 4
Press the setup key 2 times, and wait for the option display to show the 8 options selection.
Step 5
press the left arrow (or the right arrow 7 times) to move the curser all the way to the right "Charge B4 dischg" position.
Step 6
Press down arrow to change option 7 to "NoPrecharge."
Step 7
Press the left arrow 3 times to move to the "Tech Edit Off" option, and press the down arrow.
Step 8
This will take you right to the password entry display, where you will enter the password (contact me via e-mail for the password)
When finished entering the password, hit edit/display again, and you will be taken out of the setup, and will be ready to start the procedure.
The bottom line of the display will show "HCDisPWth* 2000", indicating that you have entered the Tech Edit mode.
Step 8
The results of each discharge/charge cycle will be placed into bank 0, and when you press start, the previous data will be cleared, so be sure to write down the data from bank 0 cycle 1 before adjusting the MinDischrgV * and starting the next deeper discharge cycle.
Step 9
At this point, you should see the Battery volts on the top line of the display, and have the discharger plugged in.
Press the start key
Depending on the battery voltage,and the code version you are running, you will see different prompts.
If the voltage is low (should not be the case as you were supposed to precharge the pack prior to starting the procedure), you could see the message "MDischgV too low
discharg anyways"
then after a short delay you will see
"[STOP] to Cancel
[Start to Disch "
While this message is showing, press start again.
On code V2.8 and up, a message
"Initial V match
? press DOWN now"
will show, do nothing, and the discharger should come on, and the discharge part of the cycle should start.
The display will show
Batt Volts XXX.X
Discharge XX:XX
Step 10
Now that the discharge is running, press the test key, and the bottom line of the display will show
DischTEST to indicate that you are in the deep discharge mode.
The pack will discharge down to the set MinDischegV* value and then recharge and stop, with the results in bank0 cycle 1.
As the discharge passes the point where it would have stopped in the normal discharge mode, the display will show Dischrg****, and the charger will beep continously to warn that you are in this mode.
Step 11
Recode the data from bank0 cycle 1, lower the MinDischV* and start the discharge again.
The tech edit no precharge, and deep discharge test modes will be remembered from cycle 1, so once the second and third cycles are running, you do not have to set any of those again.
All will be reset to default normal operation when the charger is powered off.
Good luck
(Posted 7/25/2013 by mikey) |
Recovery after the deep discharging. | 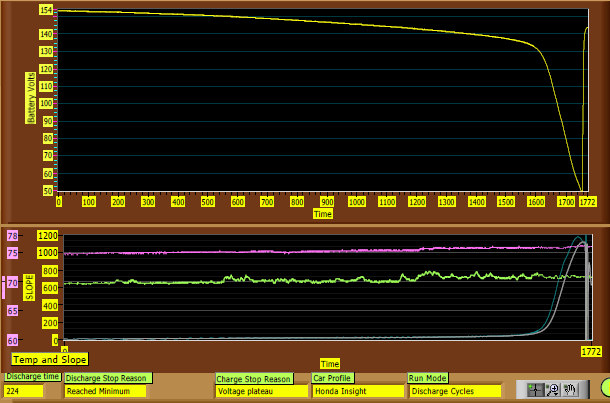 | | | Recovery after three deep cycles |
We ran another two deep discharges, and saw that the process brought all the cells into balance, and now the flat discharge slope remained flat, until all the cells dropped out together. The pack behaved quite well in the car, with no codes or strange behavior.
(Posted 4/10/2013 by mikey) |
More deep discharging. | 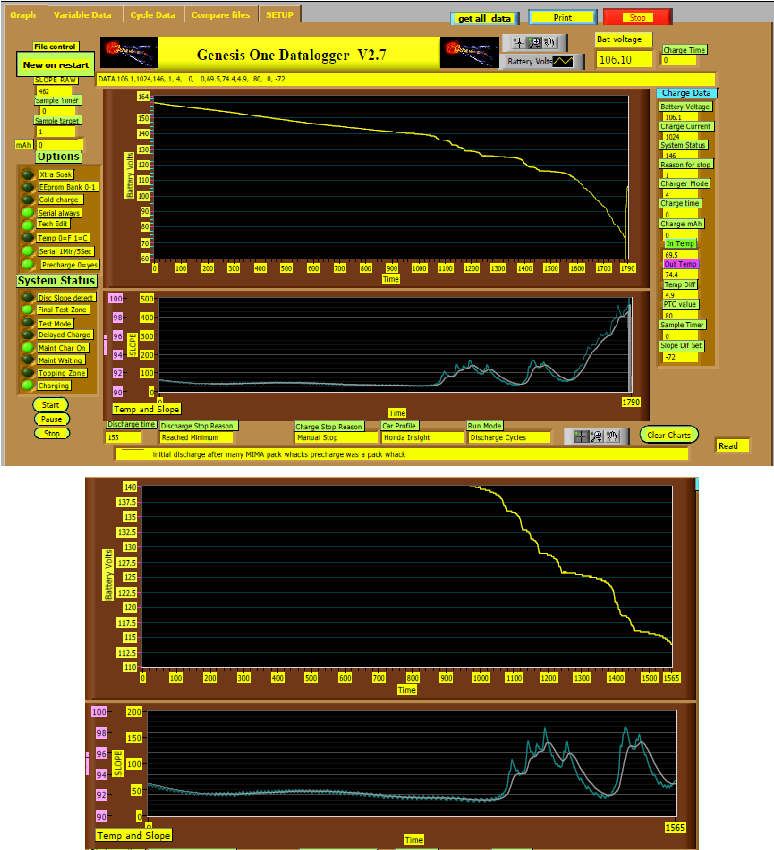 | | | initial poor condition of the pack after ful charging in the car with MIMA |
A long time MIMA user got T boned, and the car sat in the shop for a couple of weeks.
He had disconnected MIMA for the past year as His wife was driving the car, and did not want to deal with it.
The IMA was misbehaving and he had some codes and virtually no assist or regen.
He reconnected MIMA,and did aggressive charging (pack Whack) on the way down.
I started by doing a deep discharge to 75V see where the pack was at.As the graph clealy shows, many of the cells dropped out as we got into the final stages of discharge,
(Posted 4/10/2013 by mikey) |
A graphical look at silver pack deep discharge 2 | 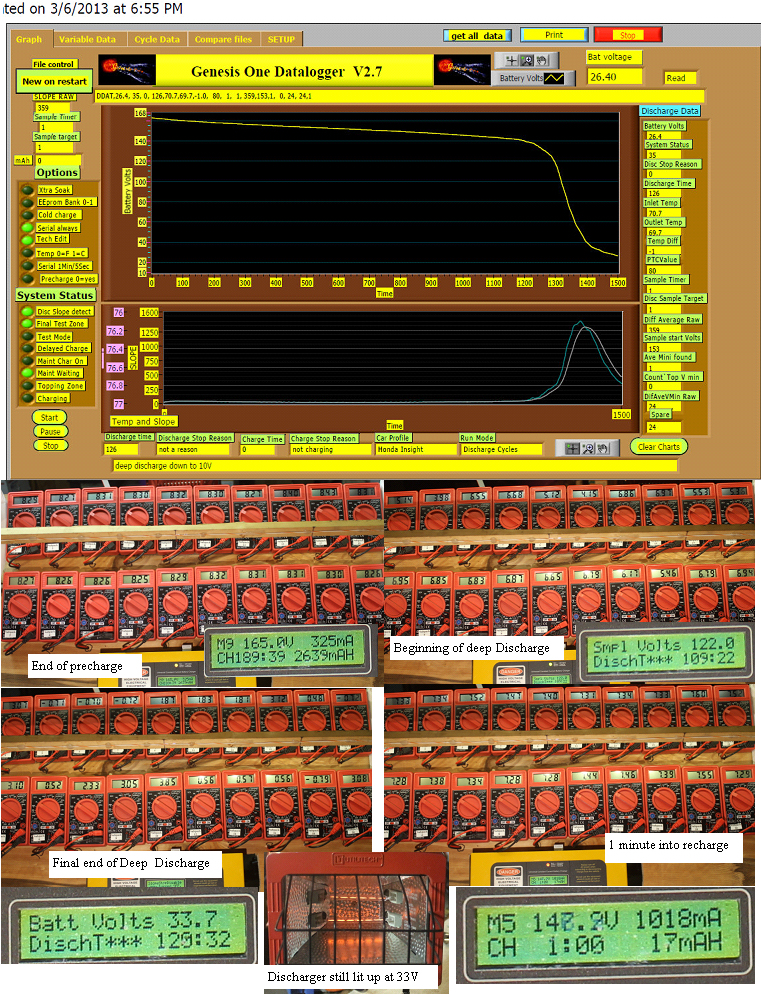 | | | graph and meters deep discharge |
Made up a 30 foot DB-9 extension cable so I could graph the next discharge with the datalogger, while working at my regular computer. I also have a a lot of the multimeter shots showing the sequence of the stick drop outs along the discharge. Have some led lights for the meters, and have the charger display in the same frame. first stick drop, and final end shot are in the photo
(Posted 3/6/2013 by mikey) |
The next discharge after a regular plateau based recharge | 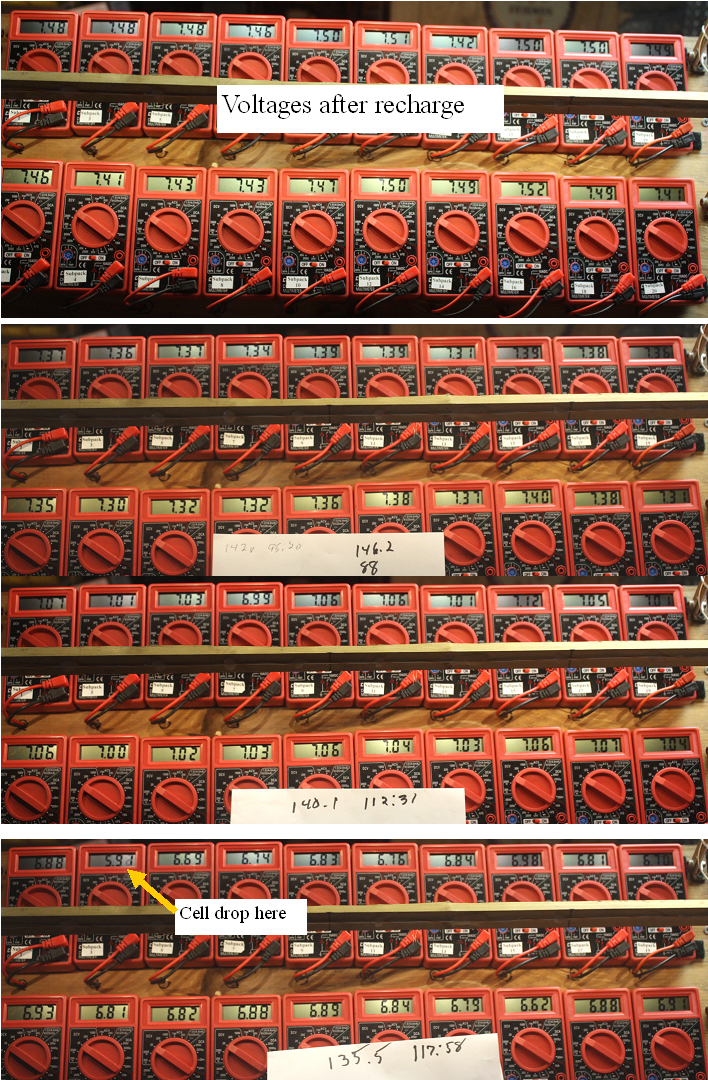 | | | looks better after the deep discharge, very interesting. |
Recharged the pack overnight, and we see that the pack not only had more capacity, but the sticks tracked each other much better on the discharge, until the same stick 3 dropped out. The reversal of the cells during the really deep discharge does not seem to do any damage (need more cell level analysis to be sure), and the sticks seem to be much better matched.
If you have a pack that has not responded well to the standard charger settings, it may be worth giving this a try?
Procedure:
1. enter password(call or e-mail me to get it)
2. change the MinDischV* to a voltage below 1V/cell.
3. set mode to 6
4. option bit 7 set to no precharge
5. with discharger connected, press start.
6 when the discharger turns on, press the test key
the message SlopeStopDisable now turned ON will be displayed, and the discharge will proceed to where it would have stopped, it will start beeping at you, but not stop until the pack is fully discharged to 10V, then it will recharge. The SlopeStopDisable will remain active, and since you cannot turn it off while recharging,you will not be able to turn it off until the next discharge cycle starts.
You could let it deep discharge for 3 cycles, turn the SlopeStopDisable off on the next discharge cycle, or change the number of cycles to 1, so you only get one cycle.
At this point, this procedure is experimental, and we have no idea if the reverse charging does any long term good or harm, but if your ready to give up on the reconditioning anyways, this may be a way t6o at least get all the cells to see a deep discharge.
I will follow this test with some more detailed cell level analysis very soon.
(Posted 3/5/2013 by mikey) |
What happens when you discharge completely? | 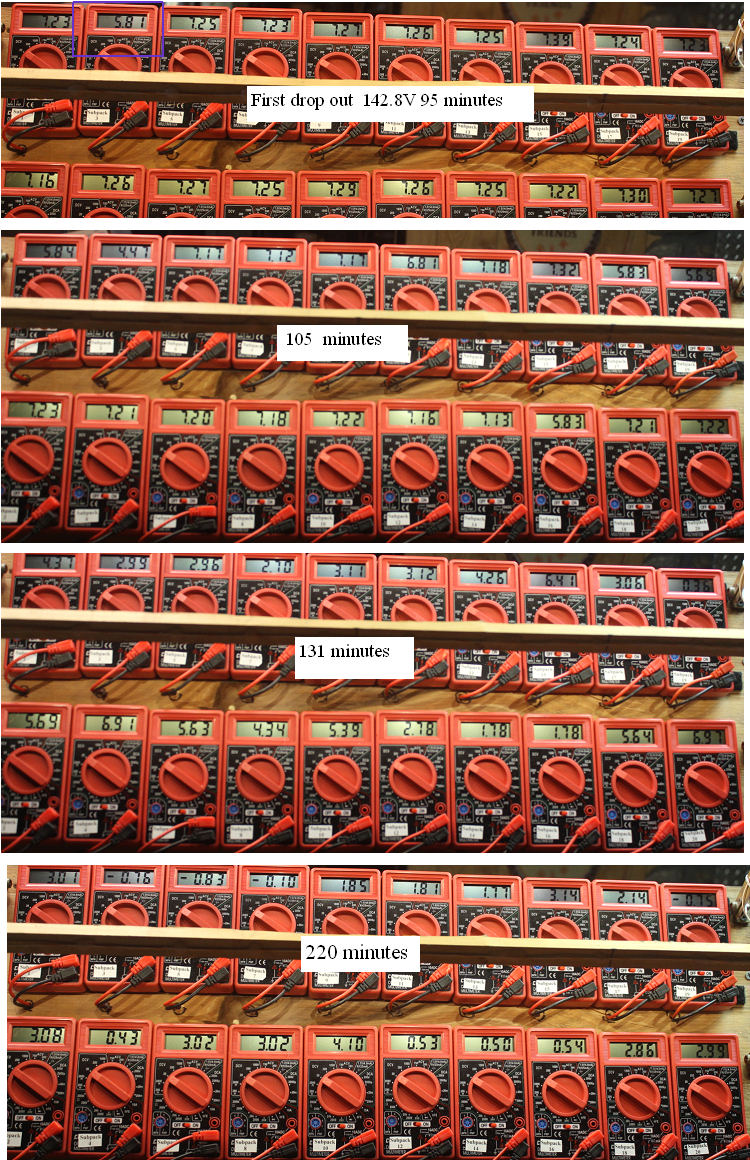 | | | nearly complete discharge of the old pack |
After some on line discussions about the effects of reverse charging the cells, and my experiment where I purposely reverse charged a cell to see what happened, and found little change in the cells capacity. I decided to take the sticks that I just pulled from my silver insight pack, and do an experiment.
This photo is the progression from when the discharger detected the first cell drop out in stick 3, until I stopped the discharge when the pack had discharged to 30 volts. We can see that the rest of the sticks gradually dropped out in a random way, with several of the sticks being completely discharged and reversed charged.
(Posted 3/5/2013 by mikey) |
Connecting to all the sticks with the multimeter test fixture | 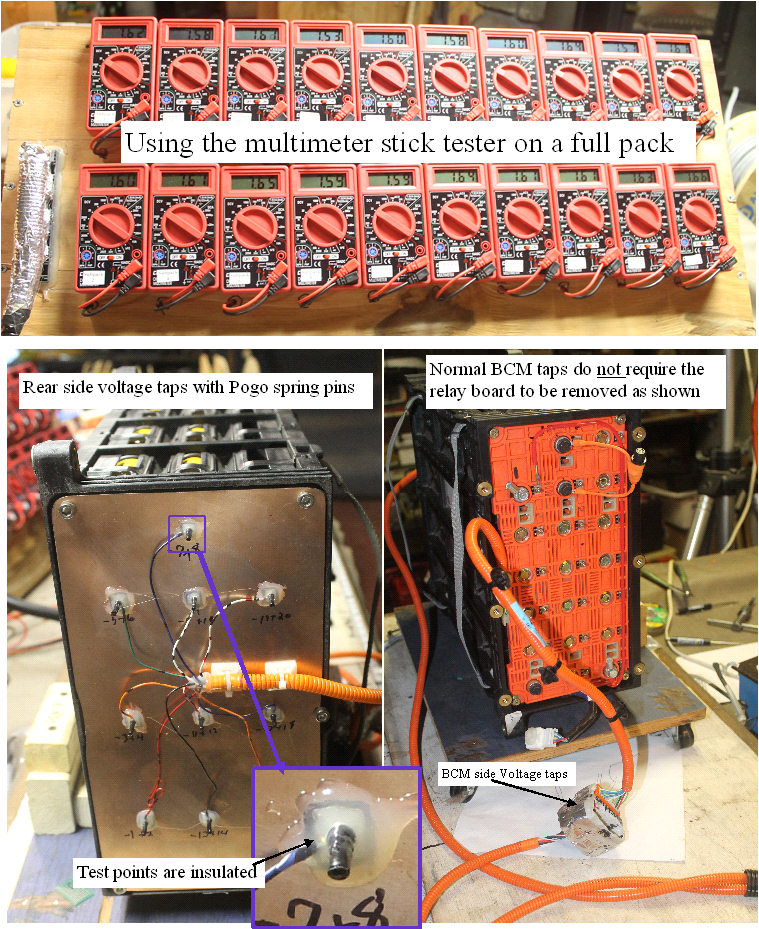 | | | Testing the saticks in a civic pack |
Took a big piece of single sided circuit board material and cut it to fit the far side of the civic pack. I located the required 10 interconnect points,using the orange interconnect plate and using a dremel tool,made an area around each point that was isolated from the rest of the plate.
drilled a close fitting hole for the pogo spring pins, and after determining the proper depth, soldered the 10 pins to the board. I connected the pin points to the multimeter harness, to complete the stick level connections, and using heat shrink, and hot glue made sure that each point was thoroughly insulated.
Now I can cycle the pack while watching each stick voltage, and also using the discharger and the special test mode, determine the relative condition of all the sticks.
(Posted 3/2/2013 by mikey) |
Testing a pack of new MaxIMA sticks with the multimeter test fixture |  | | | first discharge as a pack MaxIMA pack |
After testing the 20 sticks with the cell level tester, I moved the whole pack of sticks to my new multimeter setup, and ran a soak charge then discharge with stop disabled.
(Posted 3/1/2013 by mikey) |
First results | 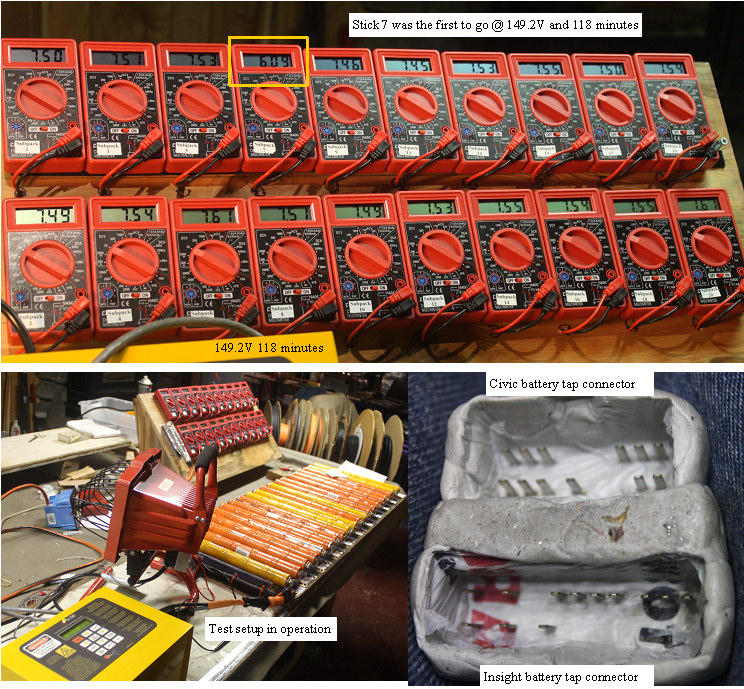 | | | first test run |
Put 20 random sticks into the fixture, and ran three cycles on them. Stick 7 was the first to drop out on all 3 cycles. As we can see, the rest of the sticks were still well above 7V, so I pulled that stick, and replaced it, and will run a few more cycles.
Crude accurate way to datalog key comparisons of the subpacks. Lots to learn at this stick level
(Posted 2/26/2013 by mikey) |
Setting up to watch the sticks | 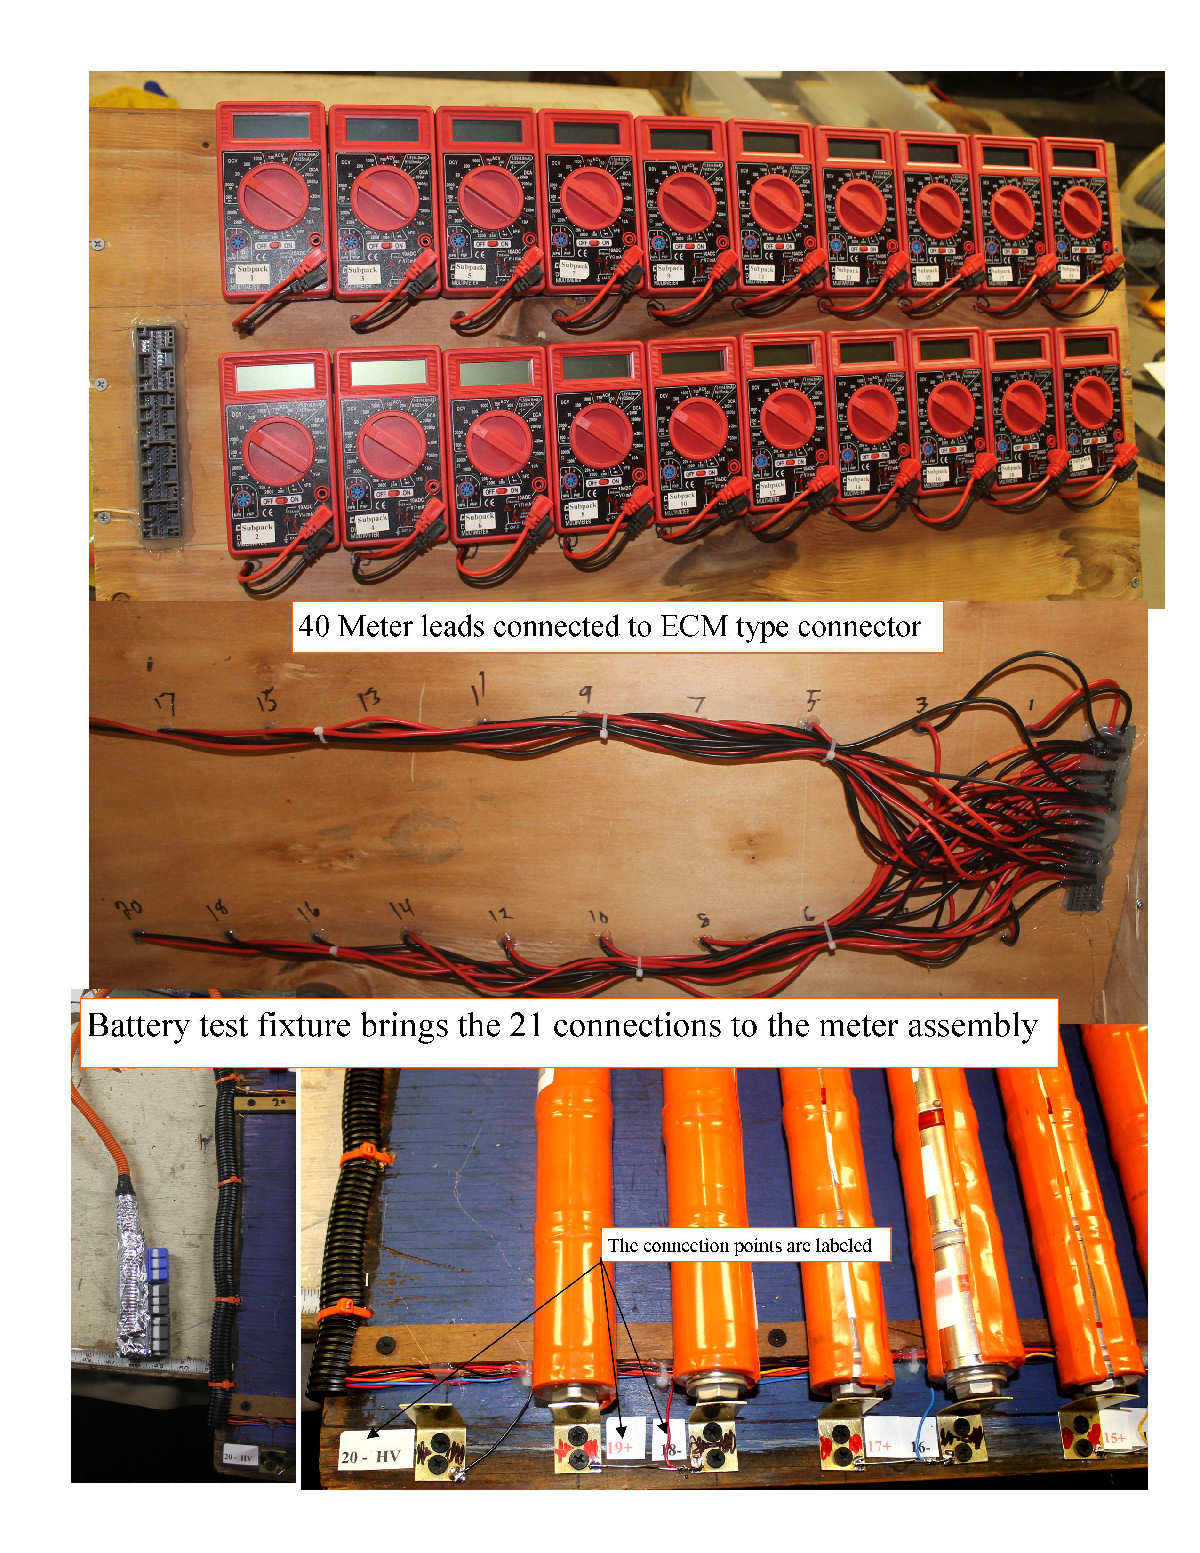 | | | test fixture is wired and operational |
Got the thing wired and tested, now to start learning what it can teach us about what is happening as we cycle the pack but at the stick level.
The in pack test harness is all wired, and waiting for some pogo pins so I can make the connections on the back side of the pack to get us down the individual sticks.
The fixture will migrate to stick level in car monitoring of the pack while in service, but is mainly just a window as to what a typical pack may look at and how it responds to the cycling.
(Posted 2/25/2013 by mikey) |
A better way to test a full pack on the stick based level | 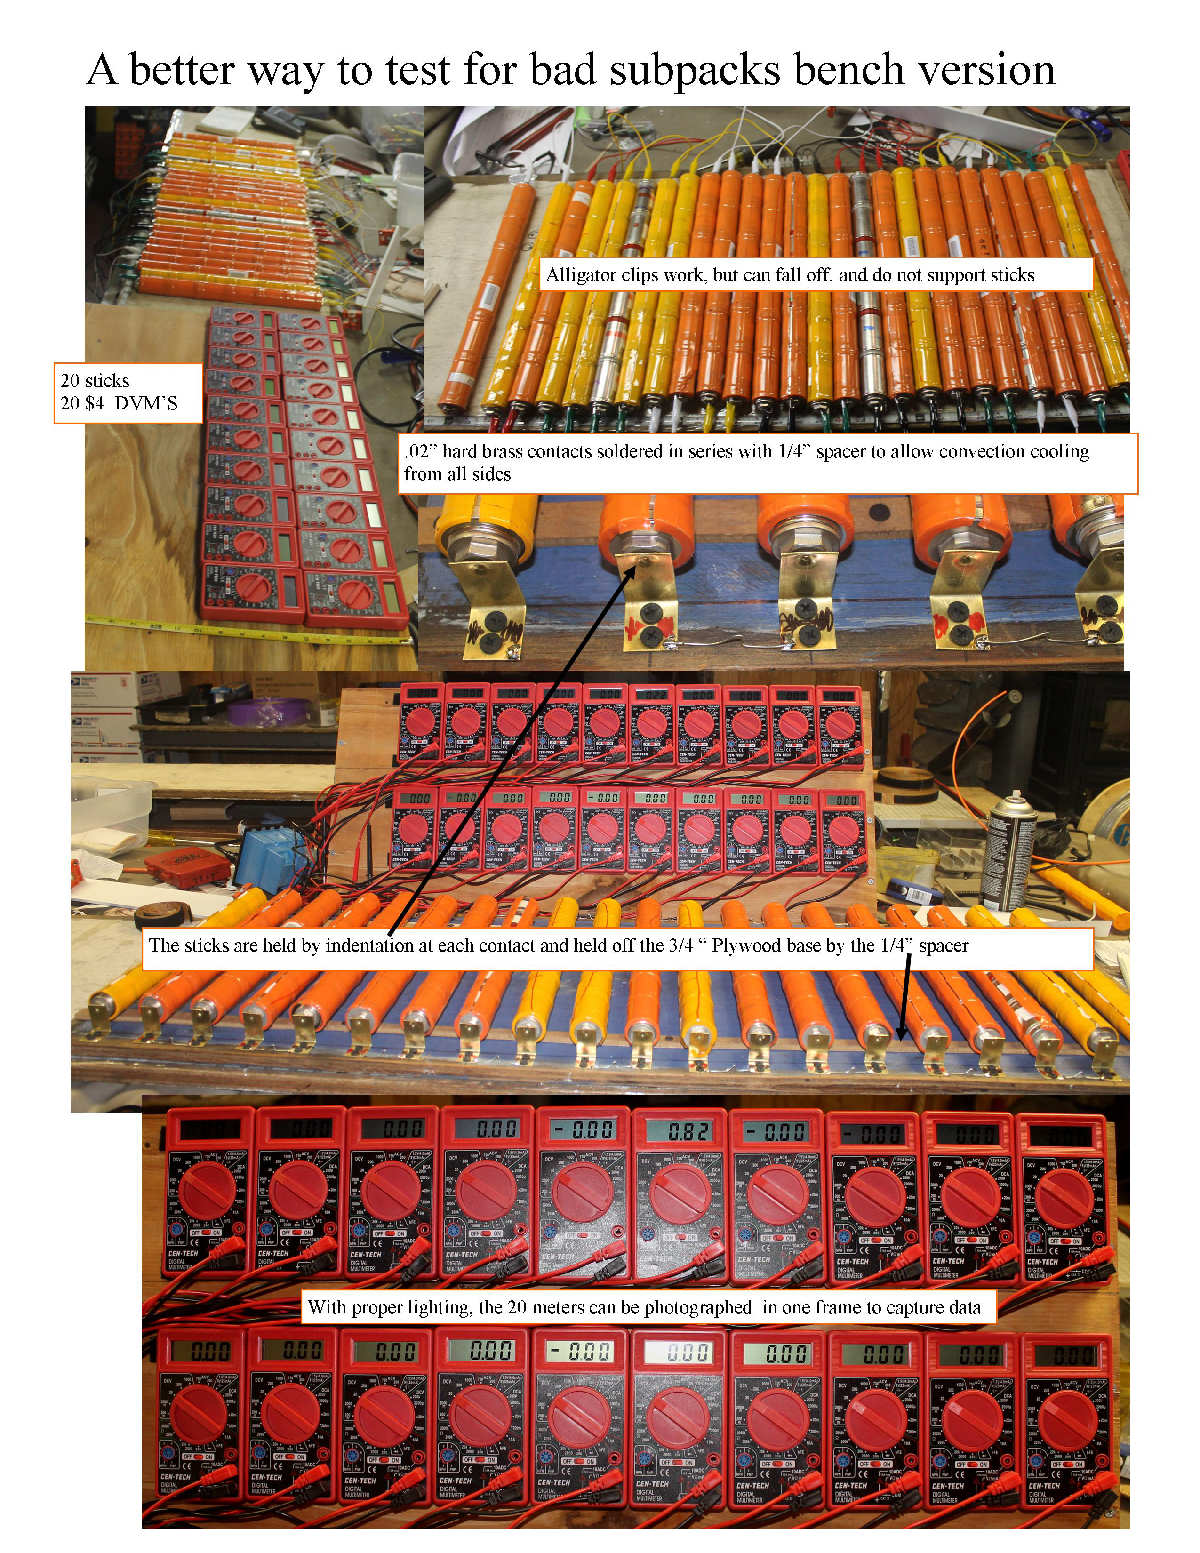 | | | A better way to test the subpacks |
I have a bunch of sticks that are some where between good and bad, and need a way to quickly sort them.
I will be developing a stick level monitoring system down the road, but wanted something that I could make and get operational quickly yet have good precision.
I started with 20 Harbor frieght DVM's which I was able to buy for $3.99 each. The DVM's are microcomntroller based, and have pretty good repeatability, and have a small calibration pot inside that allows matching the meters down to the 0.01V level.
I tested one of them, and saw that it draws 0.9MA from the included 9V battery, and the meter stays accurate until the 9v battery volts drops below where the low battery warning level display comes on.
I made a plywood back plate, and used velcro on the backing plate, and rear of the meters so they can be easily removed for calibrating and battery replacement.
To make the connections to the batteries, I sliced some hard brass .02" thick into 3/4" X 2" strips.
I ponched 2 mounting holes in ach and bent them into right angles.
I used a 1/4" rod that was rounded in a drill press to indent each contact point so it has a male protrusion to capture the 6MM screw hole on each end of the sticks.
To allow free air cooling, I put two 1/4" strips of wood across the base so it holds the sticks off the base for better cooling.
I soldered jumpers between the terminals to put all 20 sticks in series.
I will make an adapter so the same meters can be connected to a pack that has not been opened, so they can do double duty.
Cost $90 so far.
Seems to work well
(Posted 2/22/2013 by mikey) |
Time to get serious about determining what actually fails in the sticks | 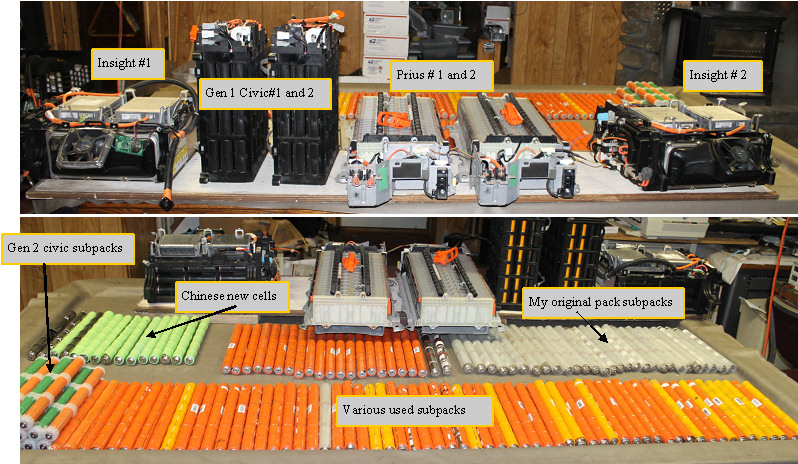 | | | Getting ready to start testing |
Since Hybrid battery repair has abandoned the pursuit of cell level rebuilding of the subpacks, and I have already built the welder, and other fixtures and test systems,that he does not want, I will use the equipment to dig deeper into determining how the subpacks look at the cell level.
A look at the traces below will show that many subpacks only have one cell that is a bad actor, others show overall deterioration that may or may not respond to charging.
Time to pin down some of the failure modes, and with the new smart chargers, we should be able to troubleshoot a problem pack and determine which sticks are acting up, and then which cells within the sticks require replacement to get the pack back into a useable condition for the least cost.
I grabbed all of the packs and sticks I have, and have assembled them so I can begin the testing.
The automatic whole pack discharger is working well with the 6 100W bulbs, so I will run capacity recovery test on all the packs I have available to see what we see.
(Posted 6/20/2010 by mikey) |
Zap test of MP 10 | 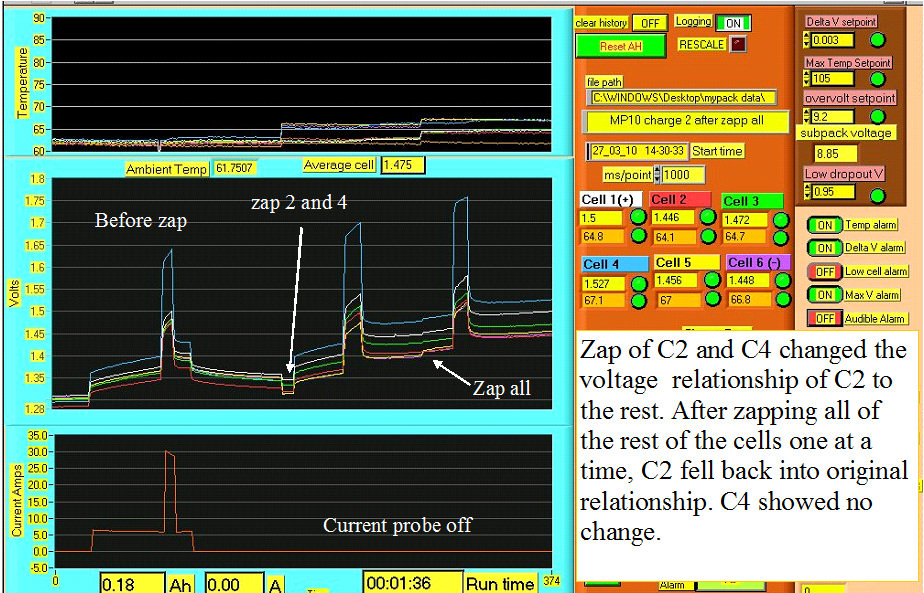 | | | Zap test on MP10 |
MP 10 has some obvious issues, so I tried the zap fix to see what would happen.
I started the run charging at ~5A, with a pulse of 30A. Next I zapped C2 and C4, which caused no change to C4, but jumped C2 up a notch.I ran that with 5A and a pulse of 30A. Finally I zapped each of the rest of the cells and did the same 5A and 30A pulse.
This seems to have jumped the voltage of all cells so the C2 again fell to the bottom of the group.
(Posted 3/29/2010 by mikey) |
Subpack 20 | 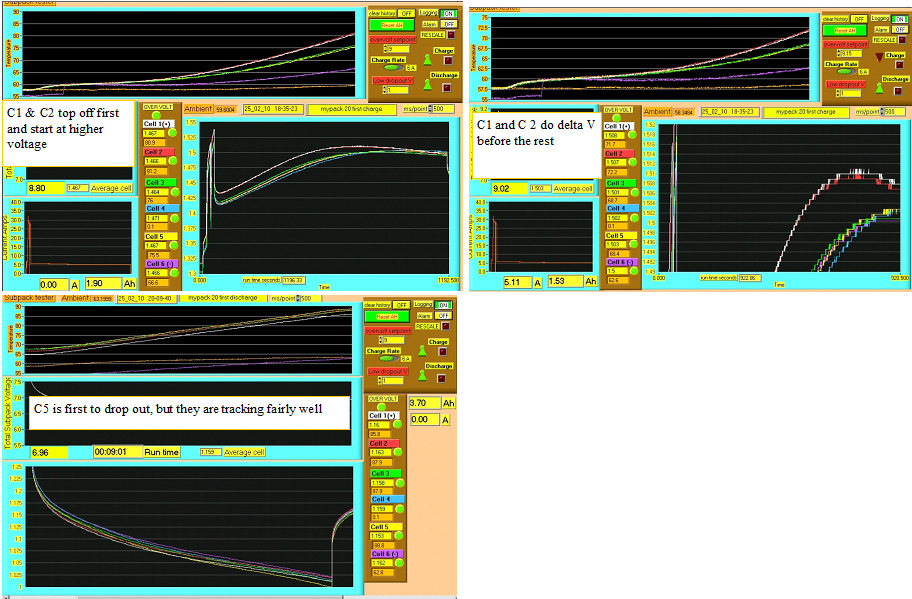 | | | Subpack 20 |
(Posted 3/27/2010 by mikey) |
Subpack 19 | 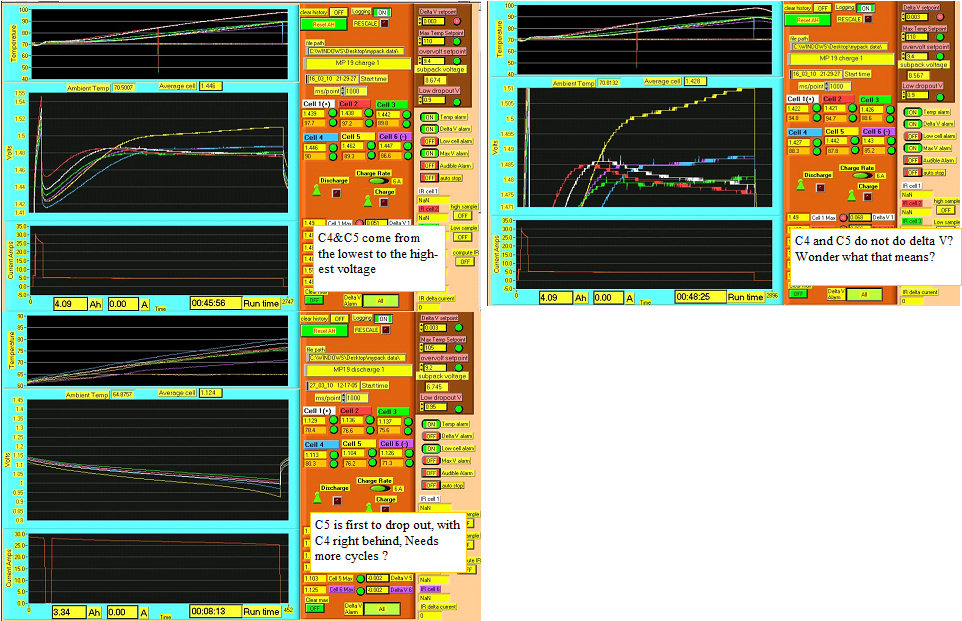 | | | Subpack 19 |
(Posted 3/27/2010 by mikey) |
Subpack 18 |  | | | Subpack 18 |
(Posted 3/27/2010 by mikey) |
Subpack 17 |  | | | Subpack 17 |
(Posted 3/27/2010 by mikey) |
Subpack 16 | 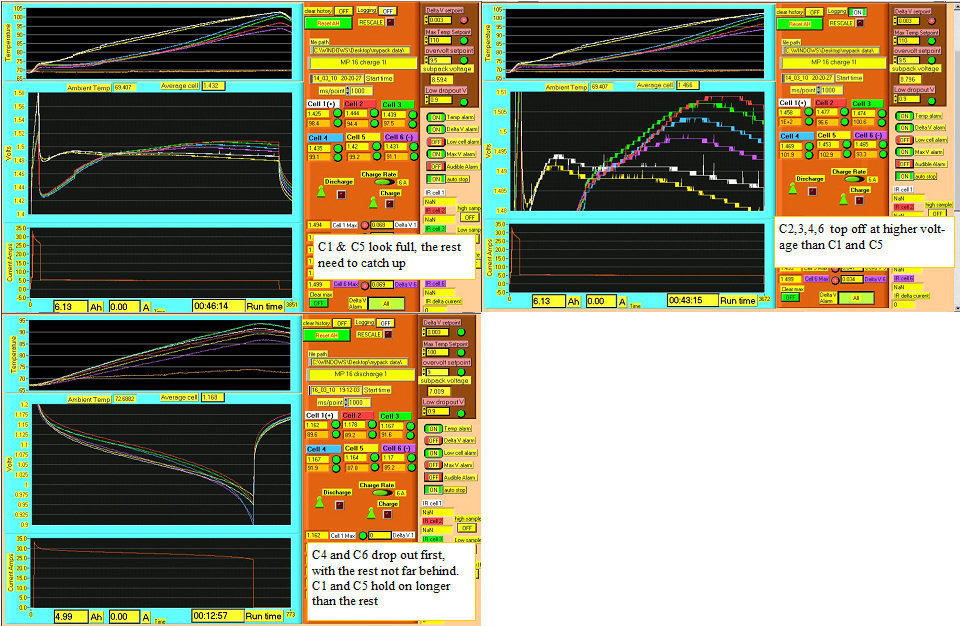 | | | Subpack 16 |
(Posted 3/27/2010 by mikey) |
Subpack 15 | 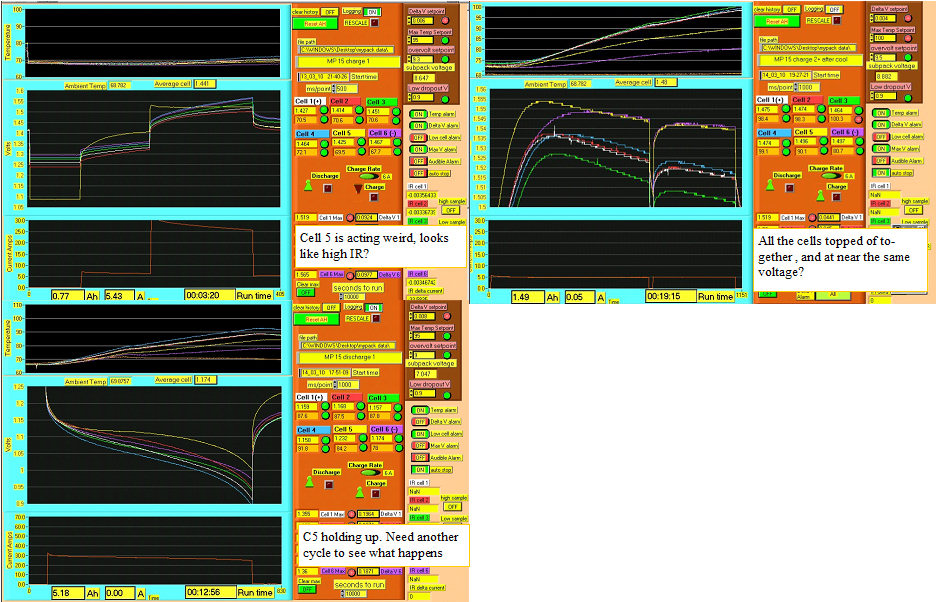 | | | Subpack 15 |
(Posted 3/27/2010 by mikey) |
Subpack14 | 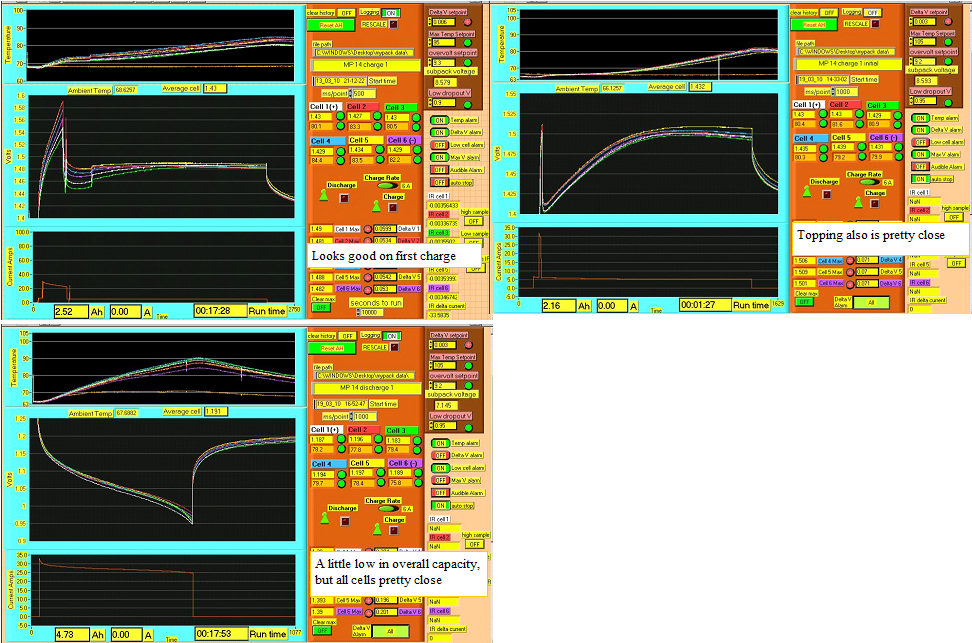 | | | Subpack 14 |
(Posted 3/27/2010 by mikey) |
Subpack 13 | 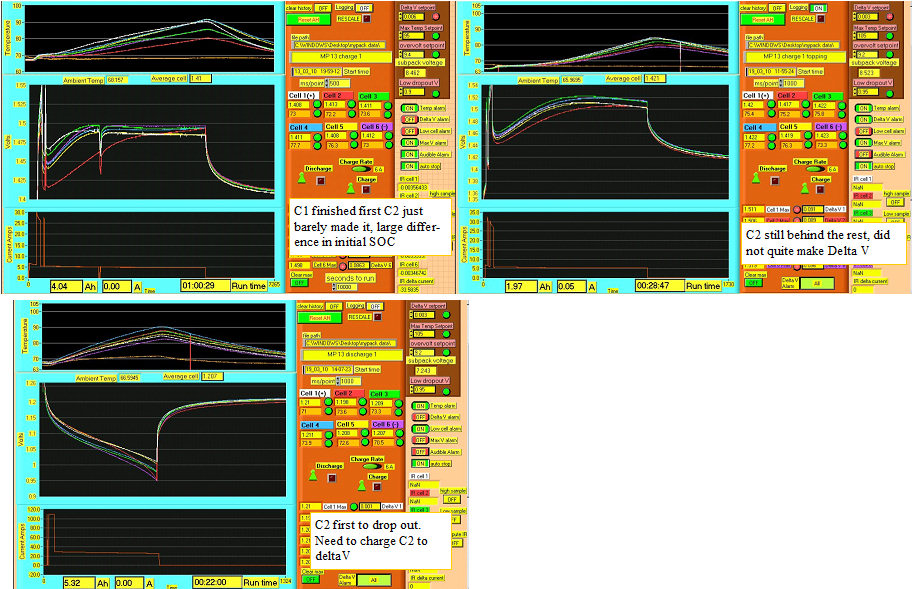 | | | Subpack 13 |
(Posted 3/27/2010 by mikey) |
Subpack 12 | 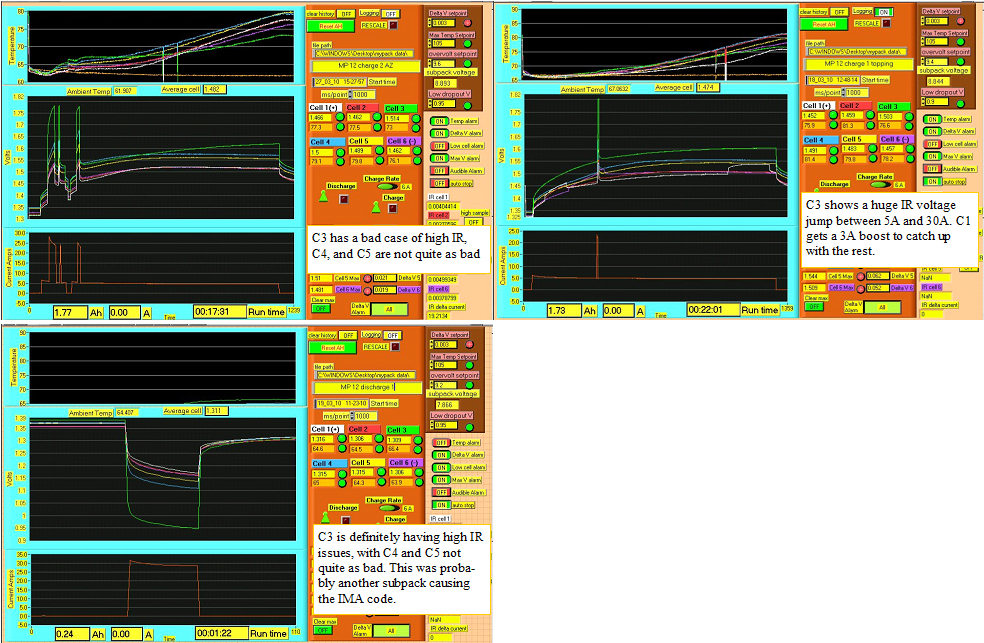 | | | Subpack 12 |
(Posted 3/27/2010 by mikey) |
Subpack 11 |  | | | Subpack 11 |
(Posted 3/27/2010 by mikey) |
Subpack 10 |  | | | Subpack 10 |
(Posted 3/27/2010 by mikey) |
Subpack 9 |  | | | Subpack 9 |
(Posted 3/27/2010 by mikey) |
Subpack 8 | 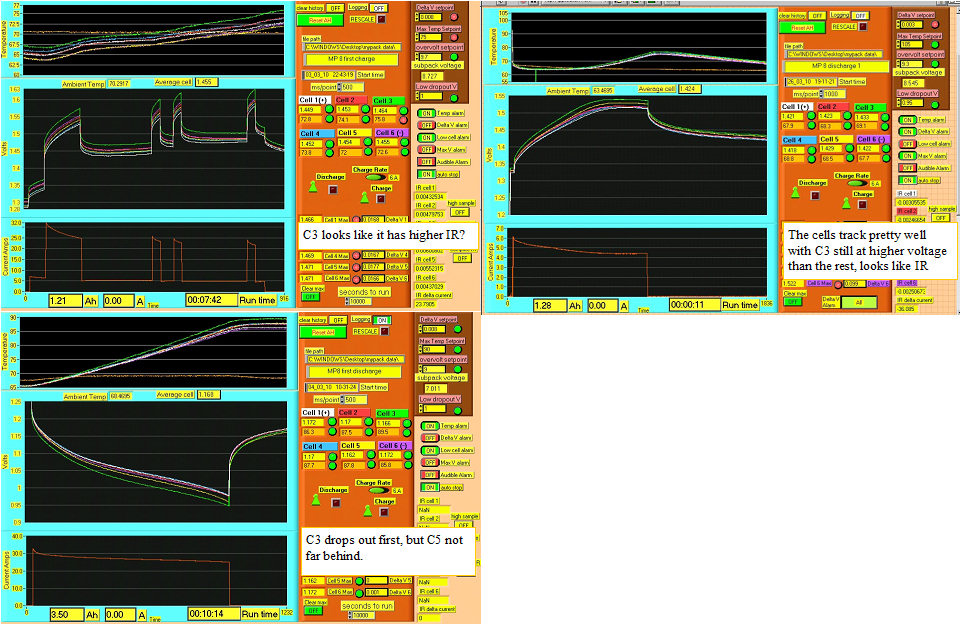 | | | Subpack 8 |
(Posted 3/27/2010 by mikey) |
Subpack 7 | 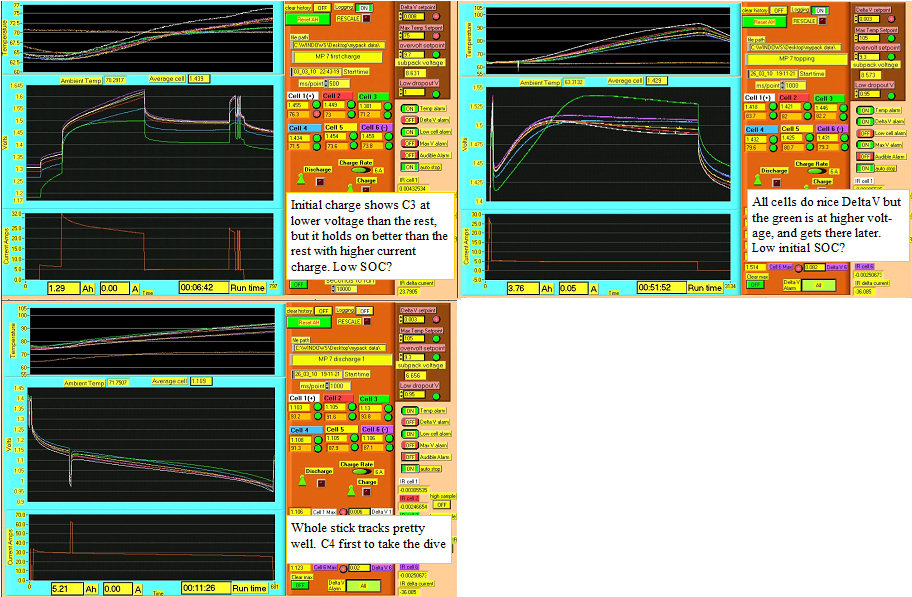 | | | Subpack 7 |
(Posted 3/27/2010 by mikey) |
Subpack 6 | 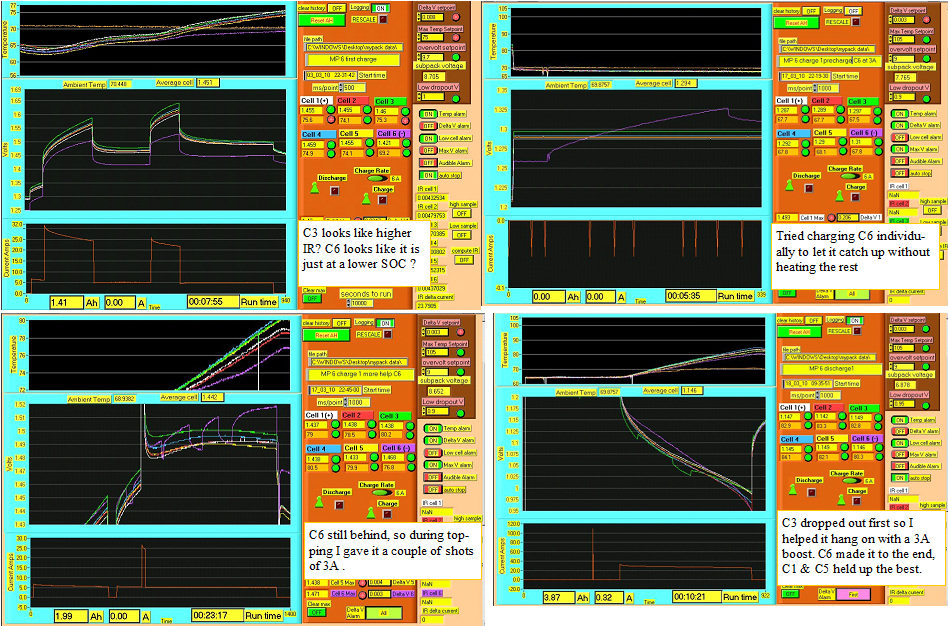 | | | Subpack 6 |
(Posted 3/27/2010 by mikey) |
Subpack 5 | 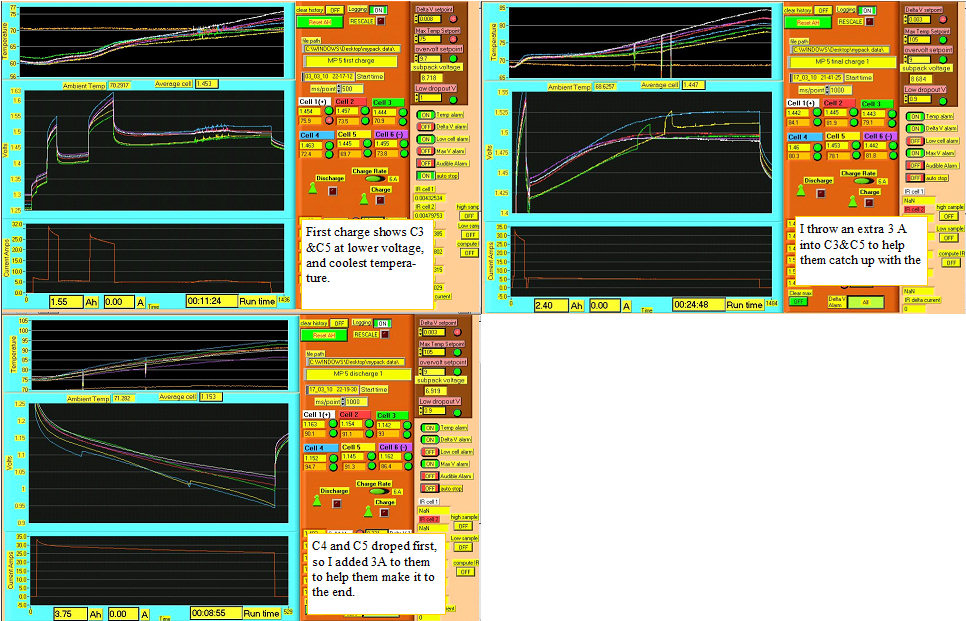 | | | Subpack 5 |
(Posted 3/27/2010 by mikey) |
Subpack 4 | 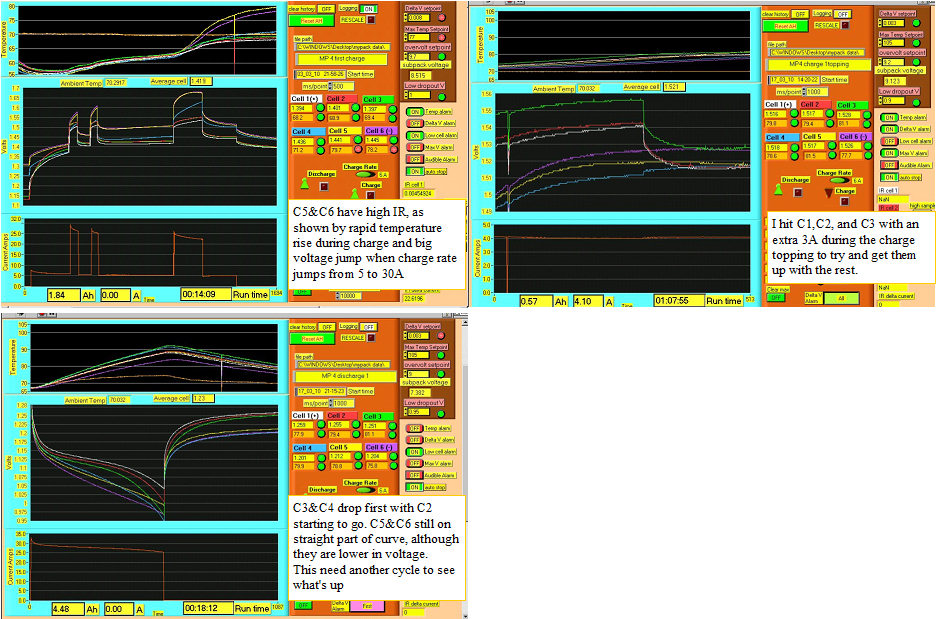 | | | Subpack 4 |
(Posted 3/27/2010 by mikey) |
Subpack 3 |  | | | Subpack 3 |
(Posted 3/27/2010 by mikey) |
Subpack 2 |  | | | Subpack 2 |
(Posted 3/27/2010 by mikey) |
Subpack 1 |  | | | Subpack 1 |
(Posted 3/27/2010 by mikey) |
|
